Content
Published:
This is an archived release.
Imports increased - exports decreased
Imports showed a slight increase whereas - in spite of increased exports of oil and gas - total exports decreased. Trade with European countries had a weak development for traditional goods, and Norway's trade with several non-European countries changed substantially.
Norwegian imports of merchandise came to NOK 20.6 billion in August and to NOK 178.7 billion in the period from January to August. The increase is 1.0 per cent for both periods from 2002. Increased imports of electricity contributed significantly. Exports of traditional goods amounted to NOK 14.4 billion in August (-6.5 per cent) and 127.4 billion (-4.6 per cent) for the period from January to August. Crude oil, natural gas and gas condensates came to NOK 22.0 billion in August (+0.3 per cent) and 178.3 billion in January - August (+4.0 per cent).
| External Trade in Goods, excl. Ships and Oil Platforms. Million NOK |
| January-August | Change in per cent | August | Change in per cent | ||||||||||||||||||||||||||||||||||||
|---|---|---|---|---|---|---|---|---|---|---|---|---|---|---|---|---|---|---|---|---|---|---|---|---|---|---|---|---|---|---|---|---|---|---|---|---|---|---|---|
| 2002 | 2003 | 2002 | 2003 | ||||||||||||||||||||||||||||||||||||
| Imports | 175 999 | 177 738 | 1.0 | 20 391 | 20 588 | 1.0 | |||||||||||||||||||||||||||||||||
| Exports | 303 581 | 305 682 | 0.7 | 37 304 | 36 377 | -2.5 | |||||||||||||||||||||||||||||||||
| Of which | |||||||||||||||||||||||||||||||||||||||
| Crude oil | 130 776 | 131 749 | 0.7 | 17 867 | 17 593 | -1.5 | |||||||||||||||||||||||||||||||||
| Natural gas | 36 361 | 43 205 | 18.8 | 3 282 | 4 162 | 26.8 | |||||||||||||||||||||||||||||||||
| Condensates | 4 262 | 3 322 | -22.1 | 751 | 215 | -71.3 | |||||||||||||||||||||||||||||||||
| Exports excl. crude oil, natural gas and condensates | 132 183 | 127 405 | -3.6 | 15 404 | 14 407 | -6.5 | |||||||||||||||||||||||||||||||||
| Trade balance (2-1) | 127 582 | 127 943 | 0.3 | 16 913 | 15 789 | -6.6 | |||||||||||||||||||||||||||||||||
| Trade balance excl. oil, natural gas and condensates (3-1) | -43 816 | -50 333 | . | -4 987 | -6 182 | . | |||||||||||||||||||||||||||||||||
Traditional goods
Adjusted for seasonality the import value of traditional goods increased by 1.6 per cent from July to August and by 1.3 per cent in the last three months when compared with the previous three months. The value of exports decreased by 3.1 per cent from July to August and by 2.9 per cent over three months. Machinery and chemicals were among sectors with lower exports.
| Exports, selected commodity sectors. September 2002-August 2003. Seasonally adjusted. Million NOK and changes in per cent |
| Fish | Pulp and paper | Chemicals | Metals | Metals excl. iron and steel | Machinery | ||||||||||||||||||||||||||||||||||
|---|---|---|---|---|---|---|---|---|---|---|---|---|---|---|---|---|---|---|---|---|---|---|---|---|---|---|---|---|---|---|---|---|---|---|---|---|---|---|---|
| September 2002 | 2 426.63 | 914.21 | 2 172.66 | 2 703.32 | 2 142.37 | 2 330.97 | |||||||||||||||||||||||||||||||||
| October | 2 254.54 | 862.95 | 2 077.06 | 2 818.44 | 2 162.27 | 2 121.41 | |||||||||||||||||||||||||||||||||
| November | 2 154.62 | 874.51 | 2 059.15 | 2 365.22 | 1 777.26 | 2 370.00 | |||||||||||||||||||||||||||||||||
| December | 2 265.15 | 959.78 | 2 191.00 | 2 768.51 | 2 176.20 | 2 203.51 | |||||||||||||||||||||||||||||||||
| January 2003 | 2 034.99 | 809.94 | 1 978.82 | 3 115.70 | 2 443.50 | 2 041.41 | |||||||||||||||||||||||||||||||||
| February | 2 049.31 | 848.57 | 2 013.67 | 2 715.27 | 2 097.54 | 2 238.08 | |||||||||||||||||||||||||||||||||
| March | 2 057.67 | 832.30 | 2 138.89 | 2 658.73 | 2 090.23 | 2 107.32 | |||||||||||||||||||||||||||||||||
| April | 2 177.45 | 866.31 | 2 393.38 | 2 841.66 | 2 127.83 | 2 327.02 | |||||||||||||||||||||||||||||||||
| May | 2 116.76 | 833.29 | 2 192.86 | 3 364.02 | 2 720.84 | 2 361.78 | |||||||||||||||||||||||||||||||||
| June | 1 970.34 | 848.19 | 2 205.55 | 3 134.32 | 2 443.47 | 1 932.73 | |||||||||||||||||||||||||||||||||
| July | 2 068.37 | 900.56 | 2 148.19 | 3 196.82 | 2 482.24 | 2 242.89 | |||||||||||||||||||||||||||||||||
| August | 2 115.64 | 903.47 | 2 120.61 | 3 063.53 | 2 374.11 | 2 022.94 | |||||||||||||||||||||||||||||||||
| Change last three months period over previous three months | -3.1 | 4.8 | -3.7 | 6.0 | 5.2 | -8.8 | |||||||||||||||||||||||||||||||||
| Change from July to August | 2.3 | 0.3 | -1.3 | -4.2 | -4.4 | -9.8 | |||||||||||||||||||||||||||||||||
More goods from Botswana, China and Brazil
From January to August Norwegian imports of traditional goods from Botswana, the People's Republic of China and Brazil increased by 115.2, 20.9 and 42.8 per cent respectively compared with the same period in 2002. At the same timeNorwegian imports from the USA dropped by as much as 16.7 per cent, while exports of Norwegian goods to the USA rose by 10.4 per cent. Exports to Sweden, presently Norway's largest market, fell by 8.2 per cent. Exports to the UK, presently our third largest market for traditional goods, declined by 9.3 per cent. On the other hand exports to Germany were more stable with an increase of 0.2 per cent.
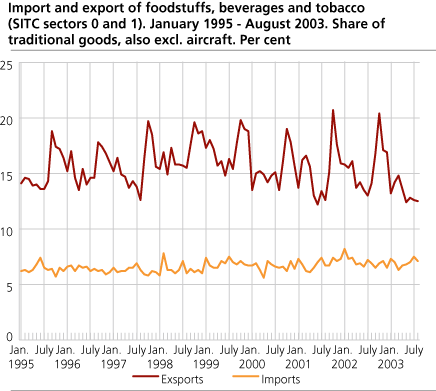
Import and export of foodstuffs
The doubling of imports from Botswana was caused mainly by increased import of ores. Apart from ores, the only noticeable Norwegian imports from Botswana were meat and meat products. Norwegian imports of meat from Brazil tripled in value in the period from January to August compared with the same period last year.
Imports of live animals, beverages and foodstuffs stood for 7.1 per cent of the value of traditional imports in August, up from 6.9 per cent last August. Exports stood for 12.5 per cent of traditional exports this August, down from 13.5 per cent last year.
Delineation
The figures are exclusive of ships and oil platforms, the same as traditional goods on the import side. For exports, traditional goods are also exclusive of crude oil, natural gas and gas condensates.
Tables:
- Table 1 Imports of traditional commodities in August and January to August 2002 and 2003. Preliminary figures. Million NOK
- Table 2 Exports of commodities, ships and oil platforms excluded, in August and January-August 2002 and 2003. Preliminary figures. Million NOK
- Table 3 Trade with countries and regional groups of countries. Traditional commodities. January-August. 2002 and 2003. Preliminary figures. Million NOK
Contact
-
Information services external trade
E-mail: utenrikshandel@ssb.no
-
Nina Rolsdorph
E-mail: nina.rolsdorph@ssb.no
tel.: (+47) 41 51 63 78
-
Jan Olav Rørhus
E-mail: jan.rorhus@ssb.no
tel.: (+47) 40 33 92 37