Content
Published:
This is an archived release.
Less surplus than in March last year
Imports in March this year came to NOK 24.1 billion, up 3.0 billion from March last year. Exports decreased by 0.9 billion to NOK 40.7 billion. The trade surplus this month was NOK 16.5 billion, a 11.2 per cent fall from March last year.
The export value in March of crude oil and natural gas amounts to NOK 24.4 billion. The crude oil quantity declined from 85 million barrels in March 2002 to 74 million barrels for March this year. The export value was about the same, since oil prices increased by 13 per cent to NOK 226 per barrel.
Surplus decrease
The 3.0 million increase in imports is most likely related to the Easter holidays, which in 2002 came in March, but in April this year. In addition, a significantly lower export of aircraft this year, compared with March 2002 contributes to lower the surplus.
Value of oil products up
The value of exports excluding crude oil and natural gas declined by 5.1 per cent or NOK 2.6 billion, from 1s t quarter 2002 to the corresponding quarter this year.
The overall reduction of the export value was somewhat counteracted by higher prices of oil products, such as gasoline, propane and butane. For this product group, the export value increased by NOK 1.9 billion in the 1s t quarter this year compared with same period last year.
Most of the other groups showed a decline. Paper, iron and steel and metals decreased by NOK 763 million, industrial machines, computer and telecommunication products by NOK 630 million and manufactured goods and chemical exports down by NOK 441.
Fish exports down
Exports of fish went down by NOK 812 million, or 11.6 per cent, ending at NOK 6.2 billion for the 1s t quarter 2003. This concerns mostly products of herring, mackerel and cod. Excluding crude oil and natural gas, fish products made up 12.8 per cent of the exports during this quarter. Products such as oil and pellets based on marine animals are not included.
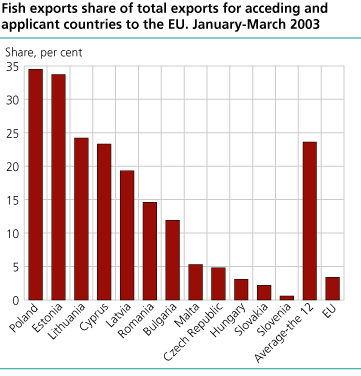
The acceding and applicant countries to the EU have a significantly higher share of fish in their imports from Norway, 23.61 per cent, than the EU. The EU Member States average is 3.4 per cent. Poland ranks on the top with a 34.5 per cent share, and is in addition the biggest fish market among the acceding and applicant countries.
Seasonally adjusted figures
Seasonally adjusted figures for the 3-month period January-March for exports of traditional goods show a decrease of 0.7. per cent compared with the period October-December 2002.
Traditional imports had an increase of 2.0 per cent for the corresponding periods.
| External Trade in Goods, excl. Ships and Oil Platforms. Million NOK |
| January-March | Change, per cent | March | Change, per cent | ||||||||||||||||||||||||||||||||||||
|---|---|---|---|---|---|---|---|---|---|---|---|---|---|---|---|---|---|---|---|---|---|---|---|---|---|---|---|---|---|---|---|---|---|---|---|---|---|---|---|
| 2002 | 2003 | 2002 | 2003 | ||||||||||||||||||||||||||||||||||||
| Imports | 66 045 | 67 442 | 2.1 | 21 161 | 24 144 | 14.1 | |||||||||||||||||||||||||||||||||
| Exports | 116 199 | 123 333 | 6.1 | 39 783 | 40 686 | 2.3 | |||||||||||||||||||||||||||||||||
| Of which: | |||||||||||||||||||||||||||||||||||||||
| Crude oil | 44 934 | 53 389 | 18.8 | 17 012 | 16 743 | -1.6 | |||||||||||||||||||||||||||||||||
| Natural gas | 19 807 | 20 215 | 2.1 | 5 490 | 7 047 | 28.4 | |||||||||||||||||||||||||||||||||
| Condensates | 682 | 1 519 | 122.8 | 216 | 561 | 159.6 | |||||||||||||||||||||||||||||||||
| Exports excl. crude oil, natural gas and condensates | 50 776 | 48 210 | -5.1 | 17 064 | 16 335 | -4.3 | |||||||||||||||||||||||||||||||||
| Trade balance (2-1) | 50 154 | 55 891 | 11.4 | 18 622 | 16 543 | -11.2 | |||||||||||||||||||||||||||||||||
| Trade balance excl. oil, natural gas and condensates (3-1) | -15 269 | -19 232 | . | -4 097 | -7 809 | . | |||||||||||||||||||||||||||||||||
| 1 | The figure was corrected 15 April 2003 at 1045 a.m. |
Tables:
- Table 1 Imports of traditional commodities in March and January-March 2002 and 2003. Preliminary figures. Million NOK
- Table 2 Exports of commodities, ships and oil platforms excluded, in March and January-March 2002 and 2003. Preliminary figures. Million kroner
- Table 3 Trade with countries and regional groups of countries. Traditional commodities. January-March. 2002 and 2003. Preliminary figures. Million NOK
Contact
-
Information services external trade
E-mail: utenrikshandel@ssb.no
-
Nina Rolsdorph
E-mail: nina.rolsdorph@ssb.no
tel.: (+47) 41 51 63 78
-
Jan Olav Rørhus
E-mail: jan.rorhus@ssb.no
tel.: (+47) 40 33 92 37

