Content
Published:
This is an archived release.
Lower trade surplus
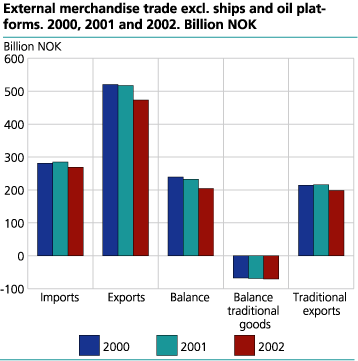
The Norwegian surplus for merchandise came to NOK 204.6 billion in 2002, 27.9 billion less than the year before. The main reason for the decline was lower export value of crude oil. While the trade in traditional goods decreased, the trade with the EU applicant countries increased in the same period.
Norwegian exports of goods in 2002 came to NOK 473.5 billion and imports to 269.0 billion.
Exports of crude oil, natural gas and condensates came to NOK 275.0 billion, a decrease of 26.6 billion compared with figures from 2001. The price of crude oil averaged NOK 196 per barrel in 2002, compared with NOK 222 in 2001.
| External Trade in Goods, excl. Ships and Oil Platforms. Million NOK |
| January-December |
Change,
per cent |
December |
Change,
per cent |
||||||||||||||||||||||||||||||||||||
|---|---|---|---|---|---|---|---|---|---|---|---|---|---|---|---|---|---|---|---|---|---|---|---|---|---|---|---|---|---|---|---|---|---|---|---|---|---|---|---|
| 2001 | 2002 | 2001 | 2002 | ||||||||||||||||||||||||||||||||||||
| Imports | 285 265 | 268 954 | -5.7 | 20 396 | 21 930 | 7.5 | |||||||||||||||||||||||||||||||||
| Exports | 517 706 | 473 515 | -8.5 | 41 447 | 40 623 | -2.0 | |||||||||||||||||||||||||||||||||
| Of which | |||||||||||||||||||||||||||||||||||||||
| Crude oil | 234 698 | 200 835 | -14.4 | 17 366 | 18 646 | 7.4 | |||||||||||||||||||||||||||||||||
| Natural gas | 61 018 | 70 984 | 16.3 | 6 919 | 7 128 | 3.0 | |||||||||||||||||||||||||||||||||
| Condensates | 5 897 | 3 222 | -45.4 | 326 | 91 | -72.2 | |||||||||||||||||||||||||||||||||
| Exports excl. crude oil, natural gas and condensates | 216 094 | 198 473 | -8.2 | 16 835 | 14 759 | -12.3 | |||||||||||||||||||||||||||||||||
| Trade balance (2-1) | 232 441 | 204 561 | -12.0 | 21 051 | 18 694 | -11.2 | |||||||||||||||||||||||||||||||||
| Trade balance excl. oil, natural gas and condensates (3-1) | -69 171 | -70 480 | . | -3 561 | -7 171 | . | |||||||||||||||||||||||||||||||||
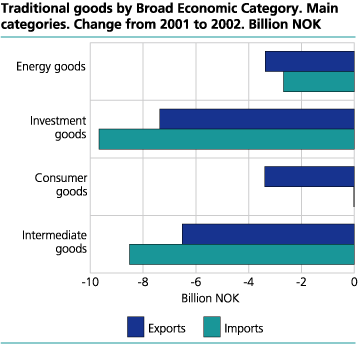
Exports of traditional goods amounted to NOK 198.5 billion in 2002, and imports to 269.0 billion. Thereby the trade deficit for traditional goods was NOK 70.5 billion, on a level with the deficit of 69.2 billion in 2001. The decrease of NOK 17.6 billion for exports came mainly from decreases of 7.4, 6.5 and 3.4 billion for investment, intermediate and consumer goods respectively. Exports of electricity increased by NOK 1.1 billion.
Seasonally adjusted figures for the last part of 2002
Adjusted for seasonality the export value of crude petroleum increased by 7.9 per cent from November to December. This is the major cause of the increase in the seasonally adjusted export total of 4.6 per cent. Exports of traditional goods decreased by 2.5 per cent from November to December, although there was a decline of 5.4 per cent from the third to the fourth quarter. The reason for the higher figures for December is an increase in the seasonally adjusted figures for exports of metals, chemicals, fish and forestry products.
Increased trade with the EU applicant countries
Norwegian exports of traditional goods to the 13 EU applicant countries Estonia, Latvia, Lithuania, Poland, Czech Republic, Slovakia, Hungary, Romania, Bulgaria, Slovenia, Malta, Cyprus and Turkey amounted to NOK 7.7 billion in 2002. This is an increase of 1.0 per cent from 2001, compared with a drop of 9.6 per cent in exports to the EU.
At the same time Norwegian imports of traditional goods from the applicant countries came to NOK 12.8 billion, an increase of 23.3 per cent, compared with a decrease of 4.4 in imports from the EU. The Norwegian imports from the applicant countries are now on a level with imports from the Netherlands.
Delineation
The figures are exclusive of ships and mobile oil platforms, the same as traditional goods on the import side. For exports, traditional goods are also exclusive of crude oil, natural gas and condensates.
Tables:
- Table 1 Imports of traditional commodities in December and January to December. 2001 and 2002. Preliminary figures. Million NOK
- Table 2 Exports of commodities, ships and oil platforms excluded, in December and January-December. 2001 and 2002. Preliminary figures. Million NOK
- Table 3 Trade with countries and regional groups of countries. Traditional commodities. January-December. 2001 and 2002. Preliminary figures. Million NOK
Contact
-
Information services external trade
E-mail: utenrikshandel@ssb.no
-
Nina Rolsdorph
E-mail: nina.rolsdorph@ssb.no
tel.: (+47) 41 51 63 78
-
Jan Olav Rørhus
E-mail: jan.rorhus@ssb.no
tel.: (+47) 40 33 92 37