Content
Published:
This is an archived release.
Increase in export value of natural gas
Norway exported for NOK 43.6 billion in July this year, while imports came to NOK 21.2 billion. This brought the trade surplus to NOK 22.3 billion for this month.
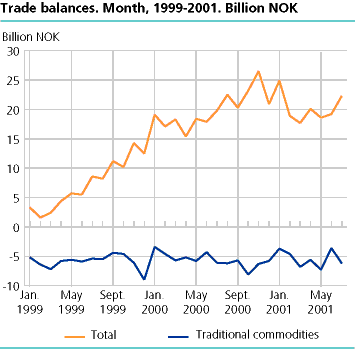
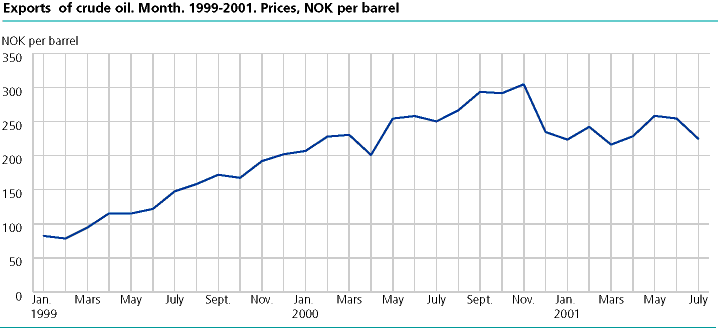
Exports of crude oil, condensates and natural gas came to NOK 28.3 billion, while exports of traditional goods to NOK 15 billion. The trade surplus per month has increased from 2 billion in early 1999 up to around 20 billion last year. For the seven months this year the surplus level has continued. There is a connection between the trade surplus and crude oil prices. The monthly average price in the beginning of 1999 was almost 80 NOK per barrel, increasing to 305 NOK per barrel in November 2000. A slight decline has brought the price the down to 225 NOK per barrel in July 2001.
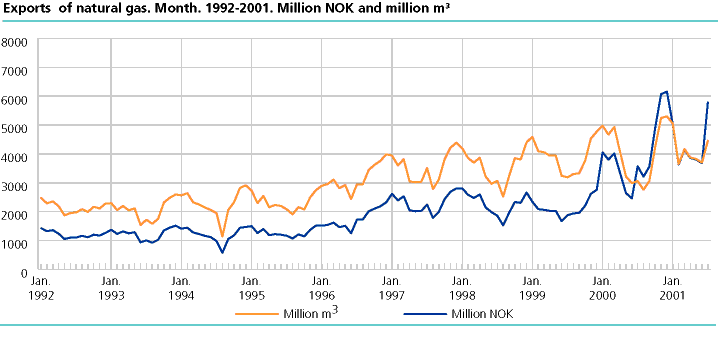
The value of exports of natural gas increased significantly in July, 62 per cent up from July 2000. However, this has been a trend during the last five years, caused by a steady increase in exported quantities. In July a clear jump in gas prices contributed to higher values.
Seasonally adjusted figures for exports of traditional goods (ships, crude oil, natural gas and condensates excluded) increased 1.0 per cent for the period Mai to July 2001, when comparing with the previous three months. For imports seasonal adjustments show a decline of 0.7 per cent, when comparing the same periods.
| External trade in goods, excl. ships and oil platforms. Million NOK |
| January-July |
Change,
per cent |
July |
Change,
per cent |
||||||||||||||||||||||||||||||||||||
|---|---|---|---|---|---|---|---|---|---|---|---|---|---|---|---|---|---|---|---|---|---|---|---|---|---|---|---|---|---|---|---|---|---|---|---|---|---|---|---|
| 2000 | 2001 | 2000 | 2001 | ||||||||||||||||||||||||||||||||||||
| Imports | 154 373 | 165 421 | 7,2 | 20 900 | 21 207 | 1,5 | |||||||||||||||||||||||||||||||||
| Exports | 280 364 | 307 237 | 9,6 | 40 669 | 43 553 | 7,1 | |||||||||||||||||||||||||||||||||
| Of which: | |||||||||||||||||||||||||||||||||||||||
| Crude oil | 137 244 | 145 642 | 6,1 | 22 342 | 22 561 | 1,0 | |||||||||||||||||||||||||||||||||
| Natural gas | 23 876 | 29 933 | 25,4 | 3 573 | 5 787 | 62,0 | |||||||||||||||||||||||||||||||||
| Condensates | . | 4 130 | . | . | 237 | . | |||||||||||||||||||||||||||||||||
| Exports excl. crude oil, natural gas and condensates | 119 244 | 127 532 | 7,0 | 14 755 | 14 969 | 1,5 | |||||||||||||||||||||||||||||||||
| Trade balance (2-1) | 125 991 | 141 816 | 12,6 | 19 770 | 22 346 | 13,0 | |||||||||||||||||||||||||||||||||
| Trade balance excl. oil, natural gas and condensates (3-1) | -35 129 | -37 890 | . | -6 145 | -6 239 | . | |||||||||||||||||||||||||||||||||
Tables:
- Table 1 Imports of traditional commodities in July and January-July. 2000 and 2001. Preliminary figures. Million NOK
- Table 2 Exports of commodities, ships and oil platforms excluded, in July and January-July 2000 and 2001. Preliminary figures. Million NOK
- Table 3 Trade with countries and regional groups of countries. Traditional commodities. January-July. 2000 and 2001. Preliminary figures. Million NOK.
Contact
-
Information services external trade
E-mail: utenrikshandel@ssb.no
-
Nina Rolsdorph
E-mail: nina.rolsdorph@ssb.no
tel.: (+47) 41 51 63 78
-
Jan Olav Rørhus
E-mail: jan.rorhus@ssb.no
tel.: (+47) 40 33 92 37

