Content
Published:
This is an archived release.
Lower exports due to low oil price
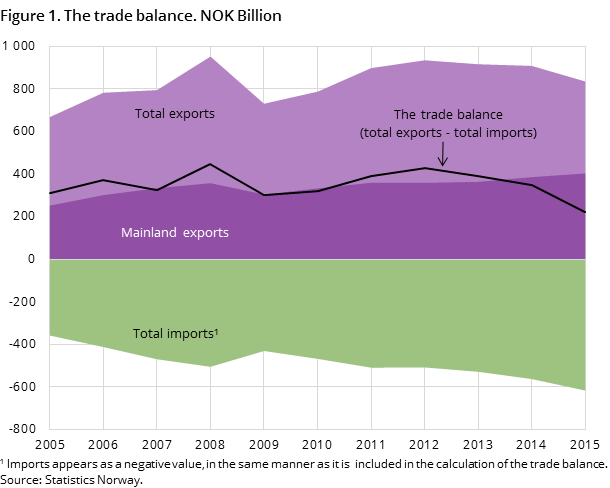
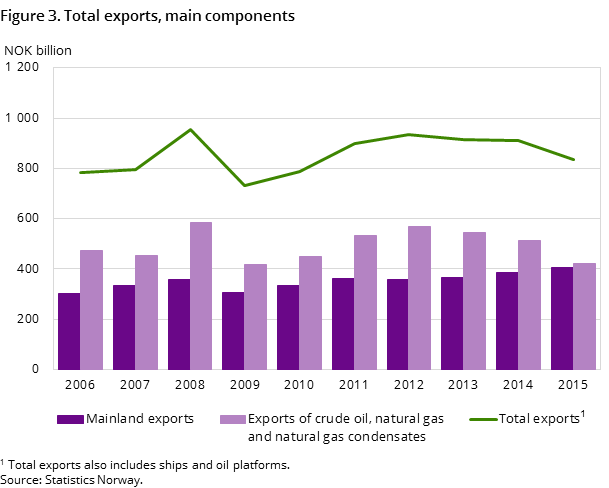
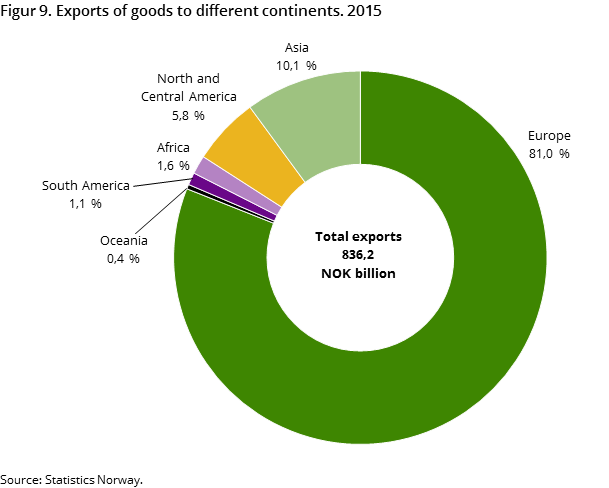
Final figures for external trade in goods show that exports totalled over NOK 836 billion in 2015, a decrease of 8 per cent compared with 2014. The decrease is mainly due to lower oil prices. Imports increased by 9.5 per cent to around NOK 616 billion.
| NOK Million | Share in per cent | Change in per cent | |
|---|---|---|---|
| 2015 | 2015 | 2014 - 2015 | |
| Imports | 615 797 | 100.0 | 9.5 |
| Ships and oil platforms | 26 962 | 4.4 | 115.5 |
| Exports | 836 166 | 100.0 | -8.0 |
| Crude oil | 197 116 | 23.6 | -30.3 |
| Natural gas | 220 676 | 26.4 | -1.3 |
| Natural gas condensates | 5 157 | 0.6 | -36.3 |
| Ships and oil platforms | 8 937 | 1.1 | 21.5 |
| Mainland exports | 404 280 | 48.3 | 4.4 |
| The trade balance | 220 369 | . | -36.4 |
| The mainland trade balance | -184 555 | . | -13.5 |
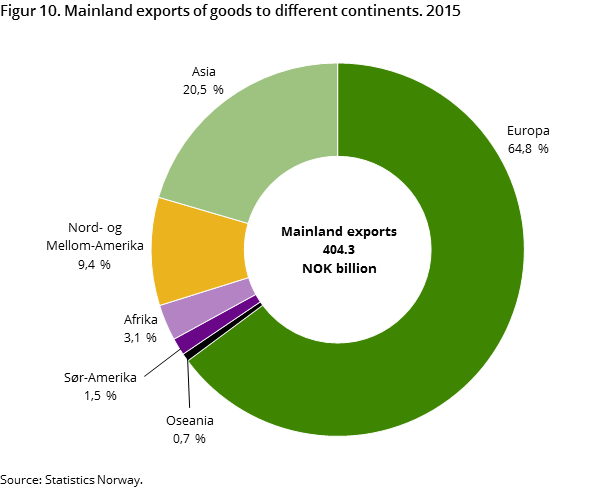
The trade surplus decreased by 36.4 per cent to NOK 220 billion. This was caused by an 8 per cent drop in exports from 2014, and an increase in imports of nearly 10 per cent. Mainland exports increased by 4.4 per cent in 2015 and totalled NOK 404 billion.
Sharp decline in the value of crude oil exports
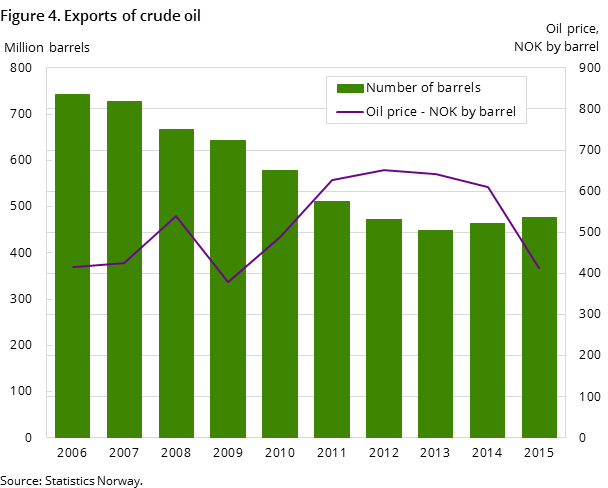
Final figures for external trade in goods show that oil with a value in excess of NOK 197 billion was exported in 2015. This is a decrease of 30.3 per cent compared to 2014. The decline was due to lower oil prices. A barrel of crude oil averaged NOK 414 per barrel in 2015, which is a decrease of NOK 197, or 32.2 per cent compared to 2014. A total of 476 million barrels of crude oil were exported in 2015, which is an increase of 2.9 per cent from the year before. Great Britain, the Netherlands and Germany received most of the Norwegian oil. These countries imported Norwegian crude oil valued at NOK 148 billion in 2015, representing about 75 per cent of Norwegian oil exports.
The final figures for 2015 show that exports of natural gas amounted to more than NOK 220 billion. This is a decrease of 1.3 per cent compared with 2014. A total of 109.6 billion cubic metres of natural gas in gaseous state were exported. This is an increase of 7.1 per cent from the previous year.
Increased mainland exports
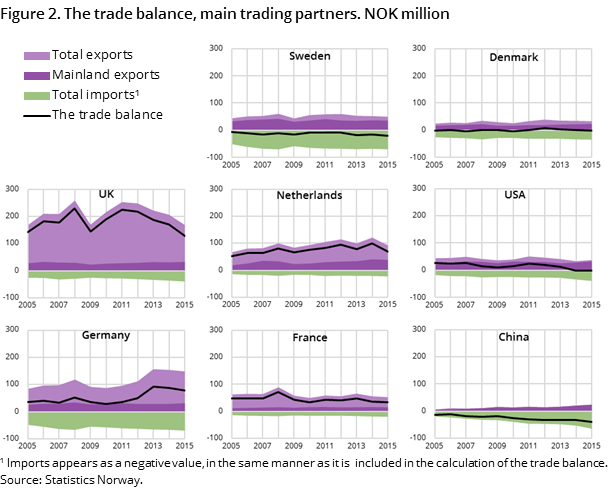
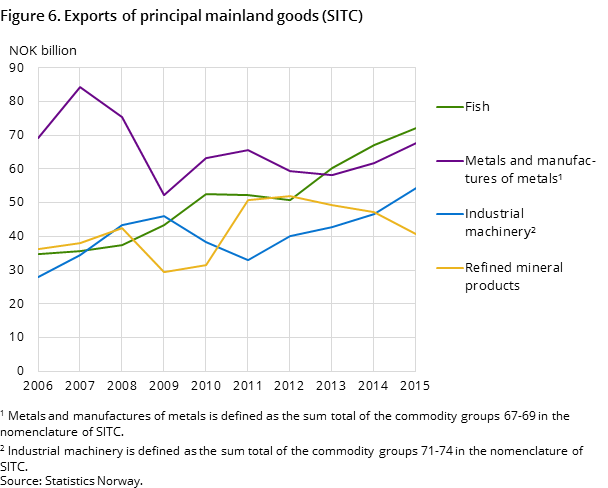
Mainland exports amounted to more than NOK 404 billion in 2015. The Netherlands, Sweden and Great Britain were the largest recipients of mainland goods. These countries received goods for more than NOK 106 billion, down 1.5 per cent from the previous year. Germany was the fifth largest importer of mainland goods from Norway - down one position from 2014. Mainland exports to Germany amounted to NOK 31.8 billion, which is almost 10 per cent lower than in 2014.
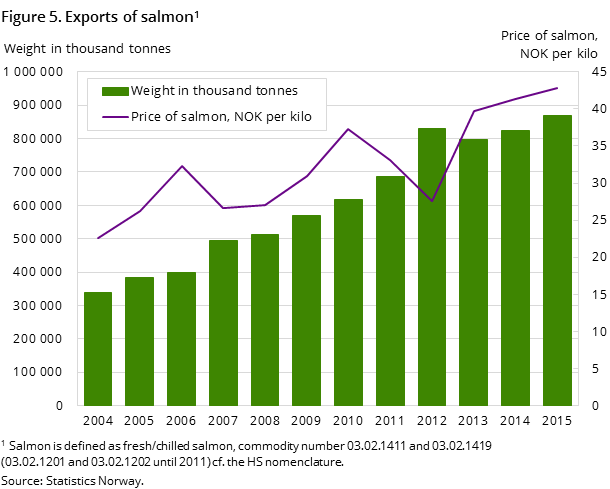
Exports of mainland goods to the USA, which was the fourth largest recipient of Norwegian goods in 2015, totalled NOK 32.3 billion. This is 15.6 per cent more than in 2014. Within this group, machinery and transport equipment as well as salmon exports increased the most. These groups rose by NOK 2.1 billion and NOK 784 million respectively and amounted to NOK 7.4 billion and NOK 3.1 billion.
Continued growth in exports to China
Mainland goods worth NOK 23.7 billion were sent to China last year. This is an increase of almost 18 per cent compared to 2014. South Korea was the eighth largest recipient of Norwegian mainland goods, with a value of NOK 16.4 billion. Exports to South Korea increased by 15.2 per cent from the previous year.
Increased imports of goods
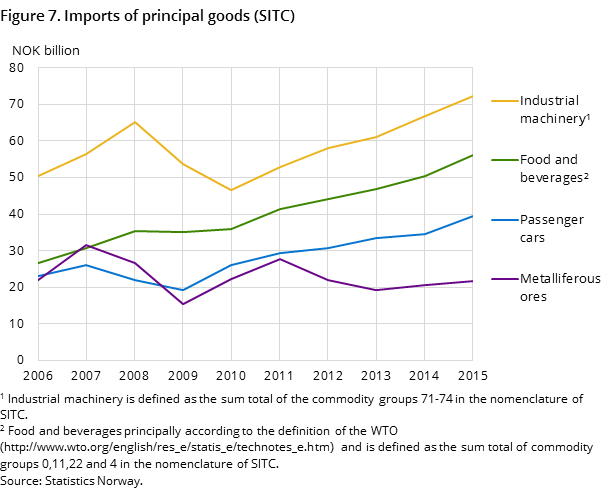
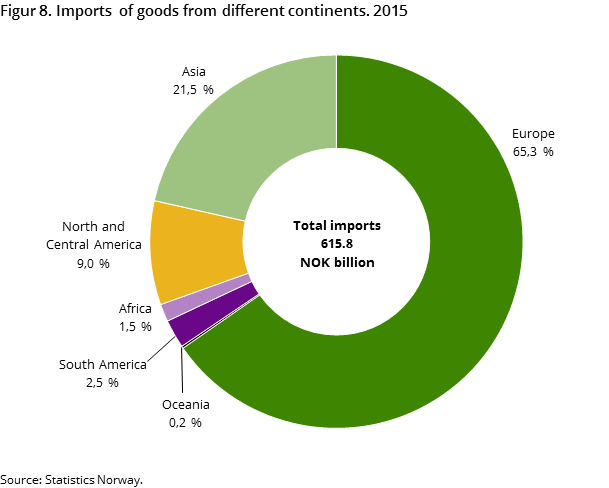
Imports increased by 9.5 per cent to just below NOK 616 billion in 2015. Only imports from Oceania and Africa decreased. Asia and South America had the strongest growth in imports, which increased by 28.5 per cent and 20.9 per cent and amounted to NOK 132.2 billion and NOK 15.2 billion.
Higher imports from Europe
We imported goods for over NOK 402 billion from European countries in 2015 - an increase of 4.8 per cent compared with 2014. Of this, 93 per cent originated from EU countries.
Sweden and Germany are the countries we import most from, and the total import value from these countries was approximately NOK 140 billion. We also imported a lot from Great Britain and Denmark, with NOK 39.4 billion and NOK 35.2 billion respectively.
Strong growth in imports from China
Imports from Asia amounted to NOK 132.2 billion in 2015. This is an increase of NOK 29.3 billion from the previous year. Import growth from Asia is much stronger than the corresponding growth in exports, causing the trade deficit with the continent to increase from NOK 27.1 billion to NOK 48 billion. China is the Asian country we import most from, with about half of Norwegian imports from Asia originating from here, with a value of NOK 64.8 billion. This is an increase of 21.5 per cent compared to 2014. Next is South Korea, from which our import value was NOK 25.6 billion – an increase of 163.5 per cent. This increase is due to the import of an oil platform.
Increased imports from Brazil
Imports from Brazil amounted to NOK 10.2 billion in 2015; an increase of 27.2 per cent compared to 2014.
It is largely inedible crude materials and food products we import from Brazil, which totalled NOK 5.8 billion and NOK 3.9 billion respectively; an increase of 40 per cent and 14.5 per cent.
Audit of external trade statistics for 2014 and 2015Open and readClose
Published figures for external trade in goods have been updated with final figures for 2015 and adjusted final figures for 2014.
An overview of the revisions is shown in table 24-27.
Since the publishing of temporary data, the oil export figures have been adjusted down by NOK 2.7 billion.
Export of natural gas has been adjusted down by more than NOK 7 billion since publishing in January.
Contact
-
Information services external trade
E-mail: utenrikshandel@ssb.no
-
Nina Rolsdorph
E-mail: nina.rolsdorph@ssb.no
tel.: (+47) 41 51 63 78
-
Jan Olav Rørhus
E-mail: jan.rorhus@ssb.no
tel.: (+47) 40 33 92 37

