Content
Published:
Updated:
This is an archived release.
Smaller trade surplus
The trade surplus amounted to NOK 343 billion in 2014 - down 10.7 per cent from 2013. This was caused by higher imports and a significant drop in oil and gas prices.
| NOK Million | Share in per cent | Change in per cent | |
|---|---|---|---|
| 2014 | 2014 | 2013 - 2014 | |
| Imports | 560 761 | 100.0 | 6.3 |
| Ships and oil platforms | 10 839 | 1.9 | -0.5 |
| Exports | 903 882 | 100.0 | -0.9 |
| Crude oil | 278 086 | 30.8 | -2.0 |
| Natural gas | 223 634 | 24.7 | -10.1 |
| Natural gas condensates | 8 100 | 0.9 | -2.0 |
| Ships and oil platforms | 7 353 | 0.8 | 5.1 |
| Mainland exports | 386 708 | 42.8 | 6.1 |
| The trade balance | 343 121 | . | -10.7 |
| The mainland trade balance | -163 214 | . | -7.1 |
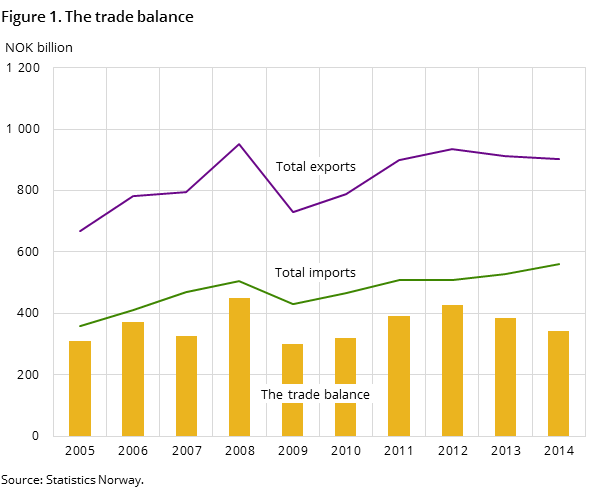
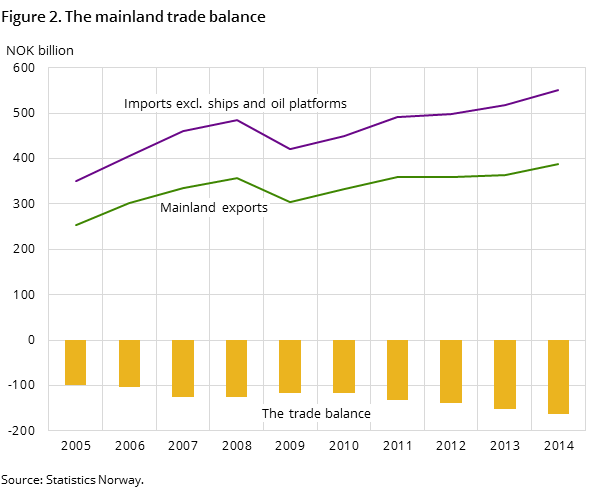
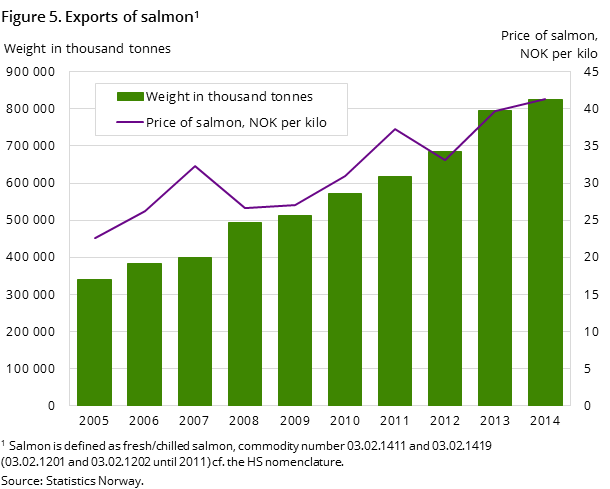
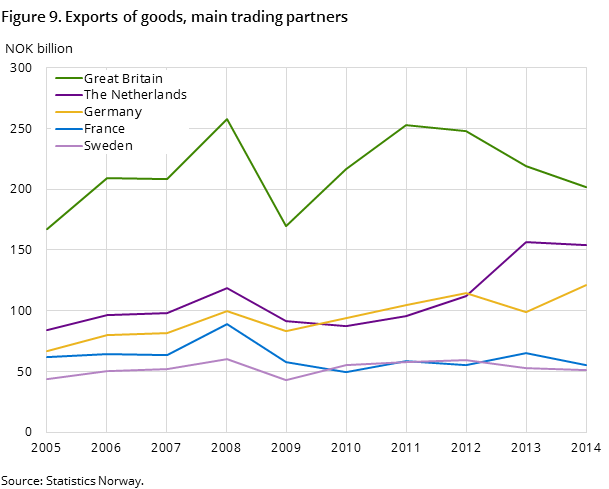
Final figures for external trade in goods for 2014 show that exports of goods amounted to nearly NOK 904 billion; a decrease of 0.9 per cent compared with 2013. Imports increased by 6.3 per cent to NOK 560.8 billion. The trade surplus thus ended at NOK 343 billion.
Lower oil and gas exports
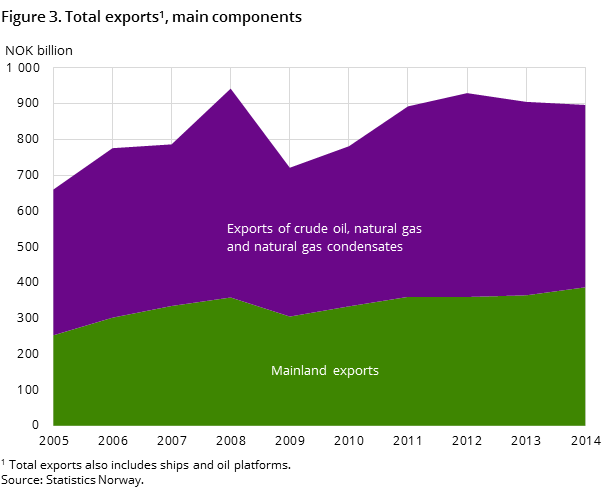
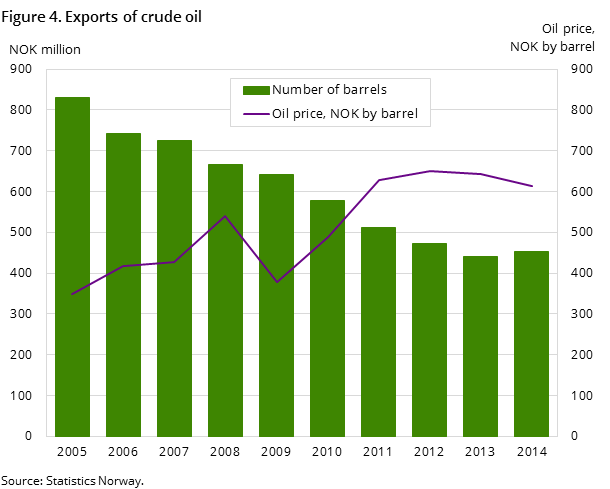
The export value of crude oil and natural gas accounted for over 55 per cent of total exports in 2014, compared with nearly 60 per cent in 2012. Crude oil with a value of NOK 278.1 billion was sent abroad in 2014; a decrease of NOK 5.6 billion compared to the previous year. The exported volume increased somewhat in 2014 compared to 2013. The cause of the drop in export value was therefore the lower crude oil price, which went down by NOK 30 and ended at NOK 613 in 2014. Great Britain, the Netherlands and Germany were the largest recipients of Norwegian crude oil. Together, these countries received almost 80 per cent of the Norwegian crude oil in terms of value.
Export of natural gas amounted to a value of NOK 223.6 billion; a decline of over NOK 25 billion compared with 2013. Norwegian natural gas exports are mostly conveyed via pipeline to northern and western Europe. The largest recipient countries for Norwegian gas in 2014 were Germany, Great Britain, France and Belgium. A total of 102 billion cubic metres of natural gas in liquid state were exported in 2014, which is 1.4 per cent less than in 2013. Germany imported Norwegian gas to a value of almost NOK 91 billion in 2014; a decline of almost 10 per cent compared to the peak year of 2013. Exports to the other three countries also decreased in 2014.
Moderate growth in exports to Europe
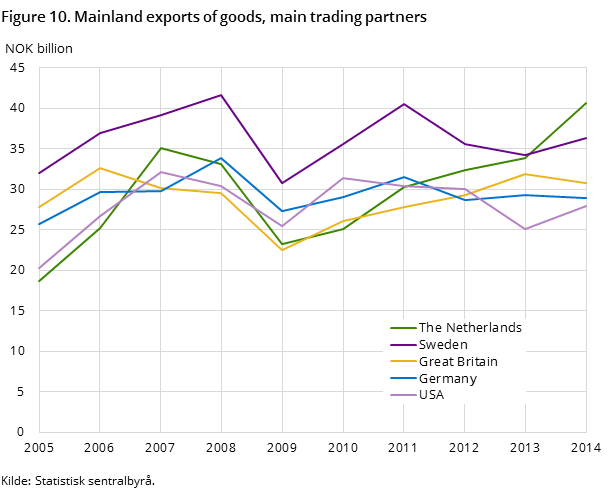
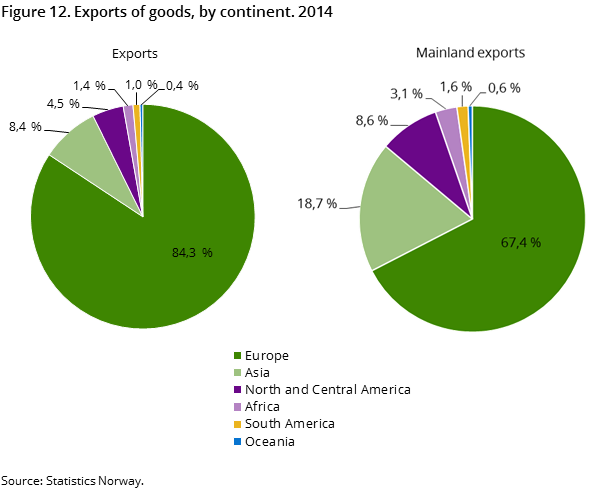
Europe received mainland goods worth NOK 261 billion in 2014. This represents almost 70 per cent of total mainland exports and constitutes an increase of 3.5 per cent from 2013.
The Netherlands, Sweden and Great Britain are the countries we exported most to. These countries received goods to a total value of nearly NOK 108 billion, which constitutes 41 per cent of exports to Europe. From 2013 to 2014, exports to the Netherlands increased the most – by NOK 6.9 billion. This is mainly due to increased exports of mineral fuels, lubricants and related materials as well as manufactured goods, which rose by NOK 2.1 billion and NOK 1.9 billion respectively.
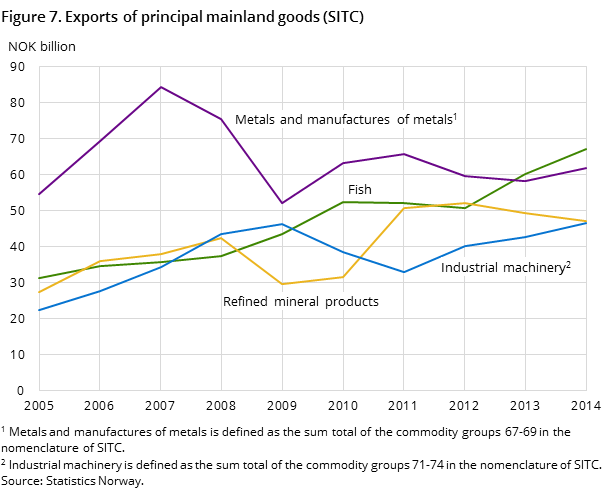
Poland and France were the main destinations for Norwegian fish in 2014. Poland received fish worth NOK 6.4 billion in 2014; an increase of 12 per cent compared with 2013. Exports of fish to France decreased by 3.1 per cent in 2014 and totalled NOK 5.7 billion. As a result of the sanctions Russia introduced in August 2014, Norway lost its most important market for Norwegian fish. This resulted in fish exports to Russia almost halving from 2013 to 2014, from NOK 6.5 billion to NOK 3.3 billion. Fish exports to Great Britain on the other hand went up by 41.3 per cent from 2013 to 2014 and amounted to NOK 3.8 billion.
Concentrated Asian exports
Mainland goods at a value of NOK 72.3 billion were sent to Asian countries in 2014. This is an increase of NOK 8 billion compared with 2013.
Only a handful of countries received the bulk of the Norwegian exports to Asia - China, South Korea, Singapore and Japan being the largest recipients - accounting for nearly 75 per cent of all Norwegian exports to Asia. Much of the exports to these countries have traditionally been machinery and equipment for Norwegian ships or platforms under construction.
China received Norwegian fish at a value of NOK 3.1 billion in 2014; an increase of nearly 28 per cent from the year before. In addition, exports of fish to Hong Kong and Vietnam, neighbouring countries of China, were valued at NOK 932 million and NOK 836 million respectively.
The total exports to South Korea decreased by almost NOK 600 million from 2013 to 2014. The main commodity group machinery and transport equipment decreased the most. For these products alone, exports fell by as much as NOK 1.3 billion. The decline is largely due to 2013 being a peak year and the completion of several large projects.
Increased fish exports to the USA
Exports to North and Central America rose from NOK 30.2 billion to NOK 33.2 billion from 2013 to 2014; an increase of 9.8 per cent. The USA accounted for almost all of this increase. Exports here increased by NOK 2.9 billion and amounted to NOK 27.9 billion in 2014. The export of manufactured goods and fish showed the largest increase, by NOK 892 and NOK 757 million respectively. The increase in fish exports is mainly due to a depreciation of NOK against the dollar.
Higher import
Imports of goods amounted to nearly NOK 561 billion in 2014, compared with 2013 this is an increase of 6.3 per cent.
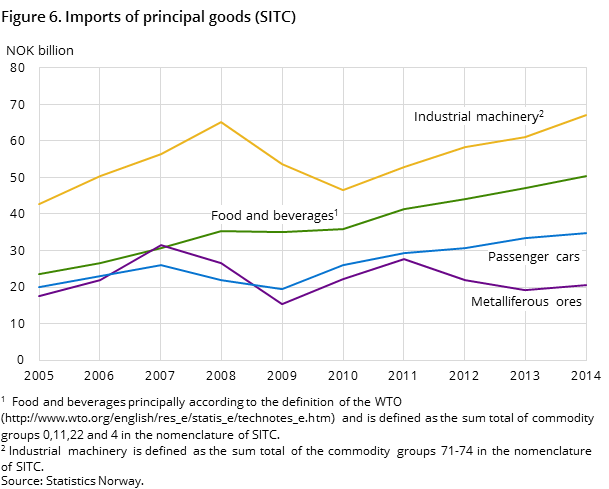
An oil platform worth NOK 4.7 billion contributed to increased imports. In addition, imports of machinery, food, manufactures of metals, electric vehicles, aircraft and telecommunications equipment increased. The largest decrease was in imports of crude oil and fuel oil.
Rapid growth in imports from the USA
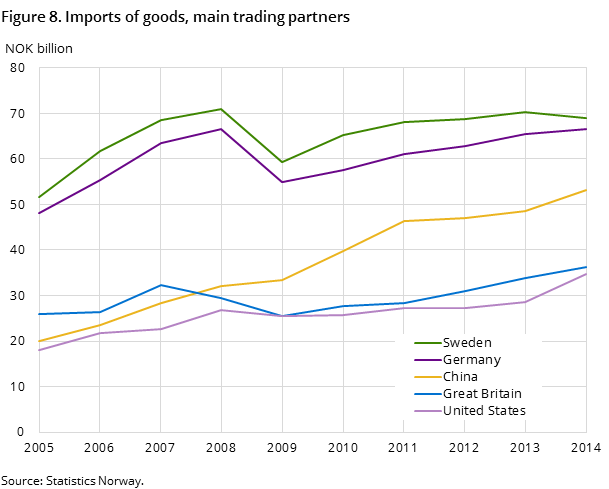
Sweden, Germany, China, Great Britain and the USA were the five countries Norway imported most from in 2014. Overall, imports from these countries amounted to about NOK 260 billion; almost half of the total import value in 2014.
The greatest growth in imports came from the USA which, from 2013 to 2014, went up by 21.6 per cent, to NOK 34.7 billion. In particular, imports of electric vehicles, which doubled compared to 2013, and aircraft contributed to this. Imports from China amounted to NOK 53 billion; an increase of 9.5 per cent compared with 2013. More than half of Norwegian imports from Asia originate from China. In 2014 we received goods worth NOK 101 billion from Asian countries. This is an increase of 10.2 per cent compared with 2013.
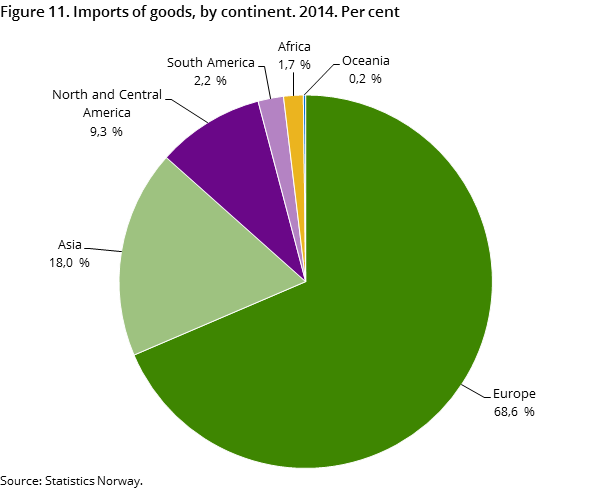
Imports from Sweden decreased by 1.9 per cent compared with 2013 and came close to NOK 69 billion in 2014. This is mainly due to reduced imports of fuel, oil and electricity. Almost 70 per cent of imports come from Europe, and the EU, through the EEA agreement, is our most important trading partner. Imports from Europe came to NOK 384 billion in 2014; an increase of 4.6 per cent compared with 2013.
0.4 per cent share of imports from LDCs
Imports from developing countries passed NOK 100 billion in 2014. The share from China accounted for over half of this, and is a great contrast compared to the imports from less developed countries.
Of the developing countries we imported most from, Thailand had the largest increase and rose by 56 per cent. This was mainly due to increased imports of structures for oil platforms. Imports from the least developed countries (LDCs) into Norway are duty free. From these countries we received goods worth NOK 2.4 billion in 2014 - accounting for only 0.4 per cent of total Norwegian imports. A large proportion of this was imports of clothing, which went up by 16.3 per cent from 2013.
Revisions on external trade statistics for 2013 and 2014Open and readClose
Previously published figures on export and import in external trade statistics is updated with final figures for 2014 and corrected final figures for 2013.
Changes are available in the tables 24-27.
Statistics Norway has decided not to continue statistics related to GSP-agreementOpen and readClose
Statistics Norway has decided not to continue statistics regarding the GSP-agreement due to uncertainty related to the preparation of data information used in the different calculations. Feedback from user indicates among others that the figures for “degree of utilization” are too high.
Contact
-
Information services external trade
E-mail: utenrikshandel@ssb.no
-
Nina Rolsdorph
E-mail: nina.rolsdorph@ssb.no
tel.: (+47) 41 51 63 78
-
Jan Olav Rørhus
E-mail: jan.rorhus@ssb.no
tel.: (+47) 40 33 92 37
