Content
Published:
This is an archived release.
11 per cent reduction in trade surplus
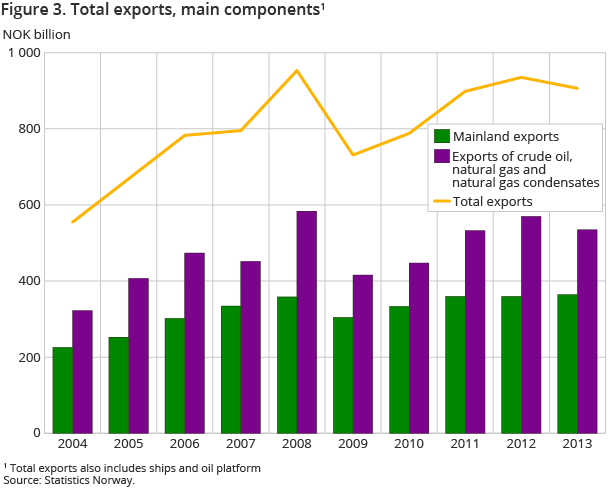
In 2013, the total trade surplus for goods amounted to NOK 378.6 billion; a decline of 11.5 per cent compared to 2012. This fall was caused by an increase in the import value, combined with a decline in the export value of crude oil, natural gas and condensate from the continental shelf.
| NOK Million | Share in per cent | Change in per cent | |
|---|---|---|---|
| 2013 | 2013 | 2012 - 2013 | |
| Imports | 527 767 | 100.0 | 4.0 |
| Ships and oil platforms | 10 896 | 2.1 | 29.4 |
| Exports | 906 398 | 100.0 | -3.1 |
| Crude oil | 277 925 | 30.7 | -9.4 |
| Natural gas | 248 643 | 27.4 | -1.4 |
| Natural gas condensates | 8 268 | 0.9 | -23.3 |
| Ships and oil platforms | 6 993 | 0.8 | 22.1 |
| Mainland exports | 364 570 | 40.2 | 1.4 |
| The trade balance | 378 632 | . | -11.5 |
| The mainland trade balance | -152 301 | . | -9.2 |
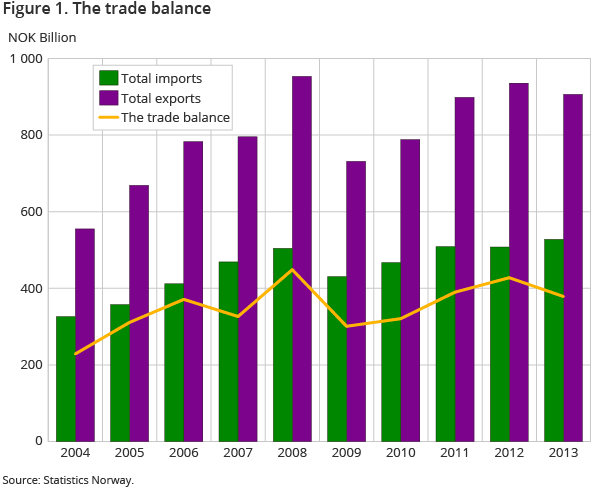
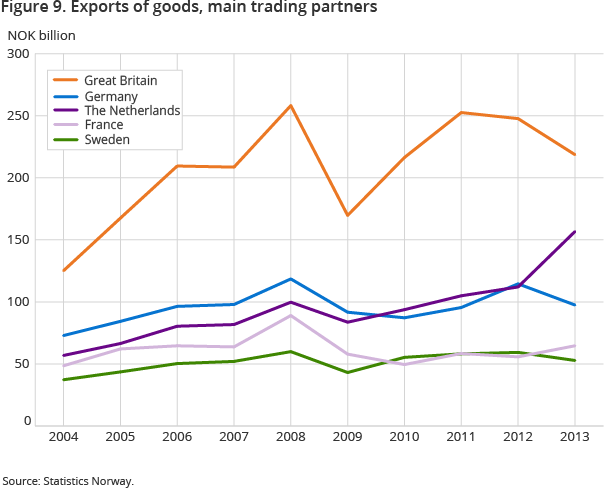
Despite the decline in the trade surplus, the 2013 value is one of the highest ever registered. Since 2005, the trade surplus has been in excess of NOK 300 billion, peaking at NOK 449 billion in 2008. In 2013, the total export value of goods amounted to NOK 906.4 billion; a decline of 3.1 per cent compared to 2012. The total import of goods came to NOK 527.8 billion; an increase of 4.0 per cent.
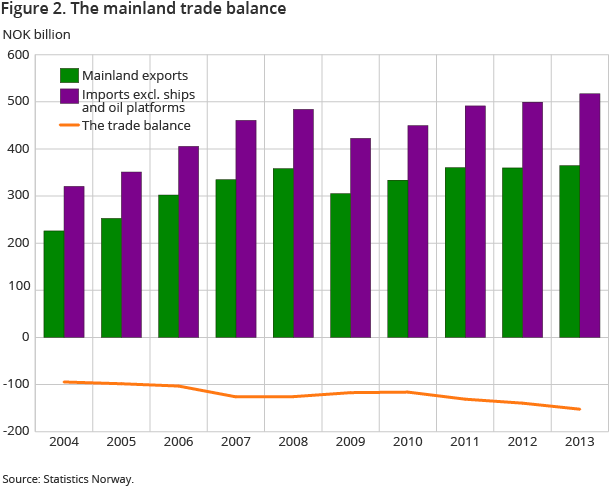
In 2013, mainland exports ended at NOK 364.6 billion; an increase of NOK 4.9 billion, or 1.4 per cent compared to 2012. Due to the large growth in import value, the mainland trade deficit increased by as much as 9.2 per cent. The deficit came to NOK 152.3 billion; the largest value ever registered.
Decrease in total exports, small increase in mainland exports
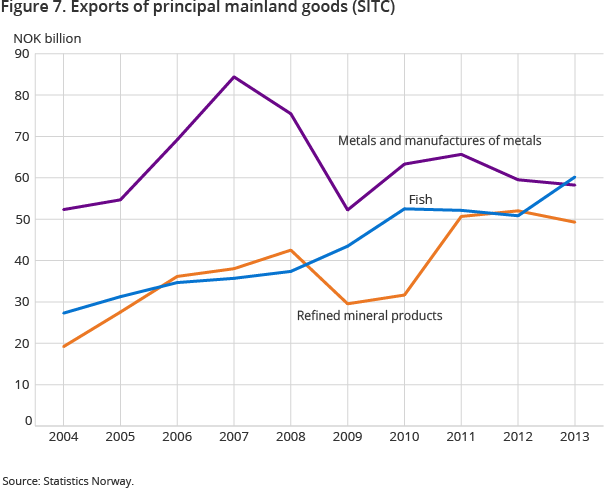
The total exports of goods dropped in 2013, and came to NOK 28.9 billion due to the exports of crude oil and natural gas, with a decline of 9.4 and 1.4 per cent respectively. Compared to 2012, mainland exports showed a 1.4 per cent increase to NOK 4.9 billion. Among the most important products, there was an increase of value for machines and fish, while metals showed a reduction.
Volume and price indices for foreign trade, which give a breakdown of export figures in volume and price, showed that the total exports (total exports excluding ship and oil platforms in these statistics) showed an increase in price of 1.9 per cent, while the volume fell by 5.1 per cent. Mainland exports showed the same tendency, with a 2.2 per cent price increase, and a decline in volume of 0.9 per cent. The rise was primarily due to higher fish prices.
Oil exports fell by almost 10 per cent
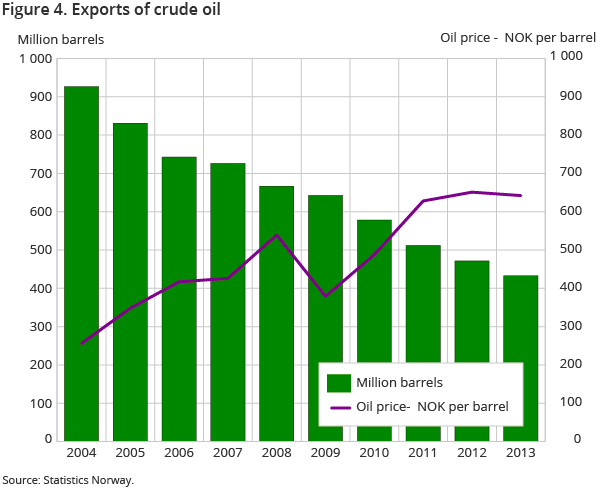
In 2013, Norway’s exports of crude oil ended at NOK 277.9 billion; a decrease of NOK 28.9 billion, or 9.4 per cent compared to 2012. The average oil price ended at NOK 642 per barrel, down NOK 8 per barrel compared to 2012. The main reason for the lower income is a reduction in exported barrels by 38.9 million.
Reduced exports of natural gas
Export values of natural gas came to NOK 248.6 billion last year; a decrease of 1.4 per cent compared to 2012. The exported quantity of natural gas, in a gaseous state, saw a significant reduction from 109.5 billion Sm3 (standard cubic metres) in 2012 to 103.8 billion in 2013; a decline of 5.1 per cent. However, the price of natural gas was higher.
Record fish exports
The export value for fish came to NOK 60.2 billion in 2013; a growth of 18.5 per cent compared to the previous year. The total quantity fell slightly from 2012 to 2013, and came to 2 331 thousand tonnes.
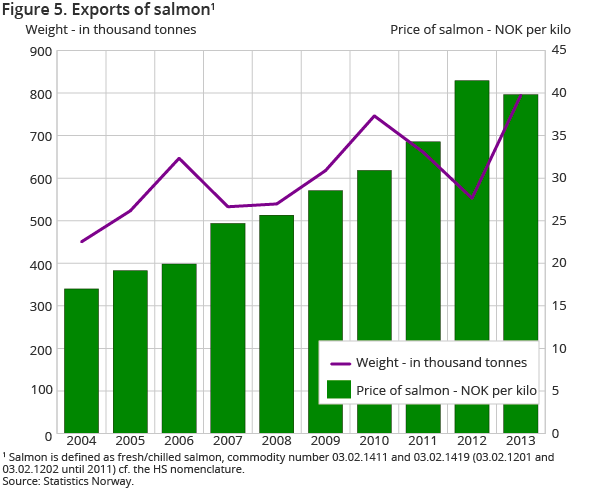
The price indices for exports of fish increased by 22.2 per cent due to the exports of fresh and chilled whole salmon, with an increase in price from NOK 27.62 per kg in 2012 to NOK 39.72 in 2013. The total export value for this product came to NOK 31.6 billion; half of the total export of fish. The increase in value for exports of fresh and chilled whole salmon came to 38.4 per cent. For cod, both the exported volume and the export value increased in 2013, while the exports of herring and mackerel declined compared to 2012. The total export value of herring and mackerel amounted to NOK 3.2 and 2.9 billion respectively in 2013.
Distribution of exports between the continents
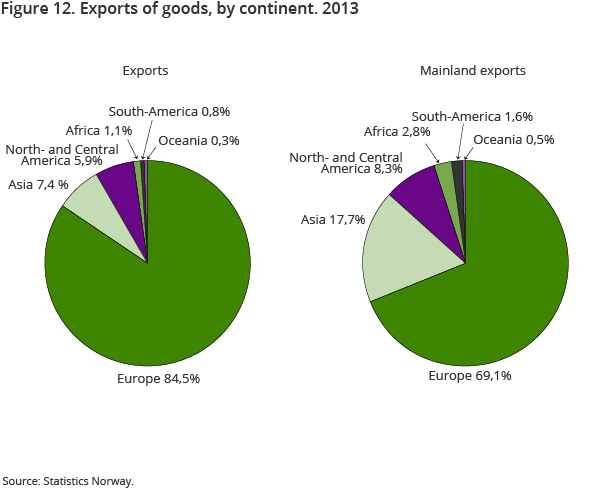
In 2013, the mainland exports to all continents increased, except North and Central America and South America, which had a fall of 15.3 and 12.7 per cent respectively compared to 2012. As in 2012, the exports to Asia had the highest growth, from NOK 58.1 billion in 2012 to NOK 64.4 billion in 2013; an increase of 10.7 per cent.
Increased exports of industrial machinery and scientific instruments
The positive progress for industrial machinery and scientific instruments in 2012 continued in 2013. In 2013, total exports for these types of commodity products came to NOK 35.2 billion; over NOK 3.0 billion and 9.4 per cent more than the previous year. European and Asian countries shared 84 per cent of the export, almost equally divided between the two continents. The exports to Europe, which were just over NOK 15 billion in 2013, have increased over the past two years, while exports to Asia increased after a decline in 2010 and 2011.
Likewise, the export of scientific instruments has increased in the last three years. The commodity group’s export values increased from NOK 9.3 billion in 2011 to NOK 12.1 billion in 2013. The increase from 2012 was scarcely NOK 1 billion, or 8.1 per cent.
Decline for metals, but chemical products slightly up
The largest drop in exports was for manufactured goods. The export value came to NOK 67.0 billion in 2013; NOK 1.8 billion less than the previous year. The decline in the group non-ferrous metals was a determining factor, dominated by the exports of aluminium and nickel. From 2011 to 2013, the export value for the aforementioned commodity group fell from NOK 46.4 billion to NOK 35.8 billion. The drop from 2012 to 2013 was NOK 4.1 billion, or 10.2 per cent. Metal goods, on the contrary, showed a significant rise, amounting to NOK 10.9 billion in 2013; an increase of NOK 3.5 billion, or nearly 50 per cent compared to 2012.
Within the same commodity group of manufactured goods, the exports of paper and paperboard dropped by 10.0 per cent, from NOK 4.9 billion in 2012 to NOK 4.4 billion in 2013. In 2011, the export value of paper and paperboard came to NOK 6.2 billion.
The main commodity group - chemical products - had a slight positive development, and the export value came to NOK 41.5 billion. The increase in value amounted to NOK 800 billion, or 2.0 per cent The export value was larger in both 2010 and 2011, but showed a decline of more than NOK 5 billion in 2012. Most of the decline can be attributed to the decrease in the solar industry.
Europe is the main export partner
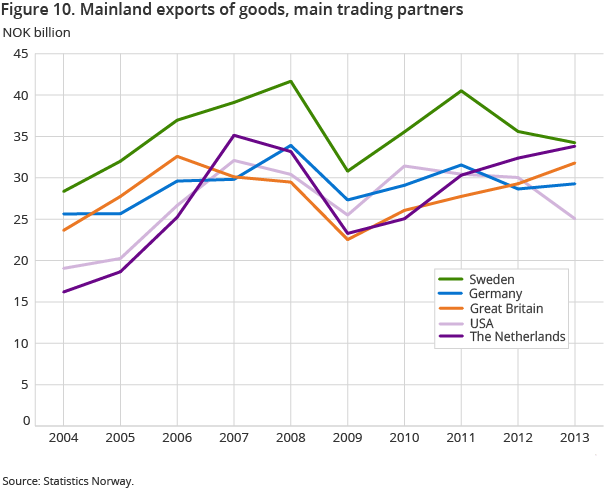
Nearly 70 per cent of mainland exports went to European countries. In 2013, Sweden remains the largest recipient of Norwegian goods, with an import value of NOK 34.2 billion; NOK 1.4 billion less than 2012. The drop in exports to Sweden was mainly due to fewer exports of non-ferrous metals, but was offset by the rise in exports of timber, manufactured goods and fish.
The next largest export partners were the Netherlands and Great Britain, showing mainland export values of NOK 33.8 and 31.8 billion respectively. Imports of mainland goods to the Netherlands increased by NOK 1.4 billion from 2012. Non-ferrous metals and fish increased by NOK 1 billion and NOK 500 million respectively. Great Britain mainly increased its import of metals. The commodity group increased from NOK 463 million to NOK 3.2 billion, while the imports of refined petroleum products dropped by NOK 2.2 billion. An increase in the export of fish to Denmark and Poland contributed to higher export values for these countries. In addition, Denmark imported refined petroleum products worth NOK 5.3 billion; an increase of NOK 1.1 billion compared to 2012.
Increase in mainland exports to Asia
In 2013, as in 2012, mainland exports to Asia increased by NOK 6 billion. The increase was mainly due to growth in exports to China, South Korea and Singapore. The exports to Japan, on the other hand, fell by NOK 1 billion compared to 2012. China’s import of Norwegian commodities ended at NOK 16.2 billion; an increase of NOK 2.3 billion compared to the previous year. Organic chemical products had the largest growth, from NOK 1.7 billion to NOK 2.7 billion. There was a significant increase in exports of electrical machinery and fish. South Korea imported Norwegian commodities worth NOK 14.8 billion, while Singapore had an import of NOK 9.3 billion; an increase of NOK 1.8 billion and NOK 2.2 billion respectively.
North and Central America
Mainland exports to North and Central America fell by NOK 2.8 billion, and amounted to NOK 35.8 billion. The main cause for the decline was a fall in the exports of refined petroleum products to Canada.
Weak growth in imports excluding ships and oil platforms
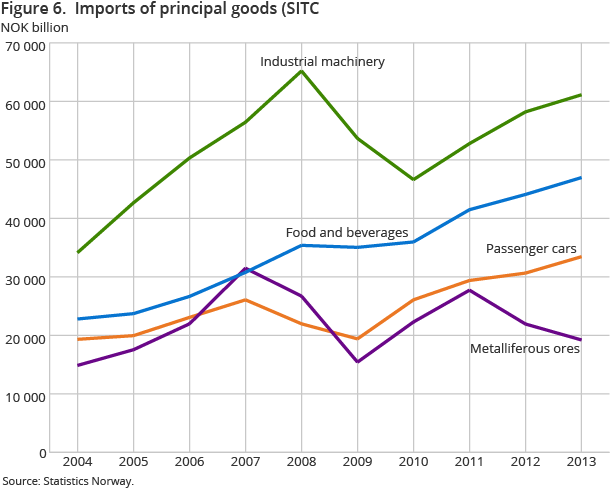
After a strong recovery for imports in 2009 and 2010, the import growth levelled off in 2011 and 2012, but showed a slight growth in 2013. Total imports in 2013 ended at NOK 527.8 billion; 4.0 per cent higher than in 2012. Excluding ships and oil platforms, there was an increase in the total imports of 3.5 per cent, or NOK 17.7 billion, ending at NOK 516.9 billion. Investment in the Norwegian Continental Shelf contributed to the growth in imports of industrial machinery. Imports of essential inputs in the Norwegian industry such as metalliferous ores and raw chemical materials, however, went down.
Weaker global economic conditions and an increasingly stronger NOK have pushed down import prices in recent years. In 2012, there was virtually no growth in import prices, but in 2013 the import prices increased. The price indices for external trade in goods showed a growth of 2.3 per cent. Volume increased, as in 2012, by 1.3 per cent.
The euro rate of NOK 7.81 in 2013 was slightly higher than in 2012. With an average value of NOK 7.47, the euro rate in 2012 was the highest since the euro’s inception in 1999.
Norwegian imports – from different trading partners
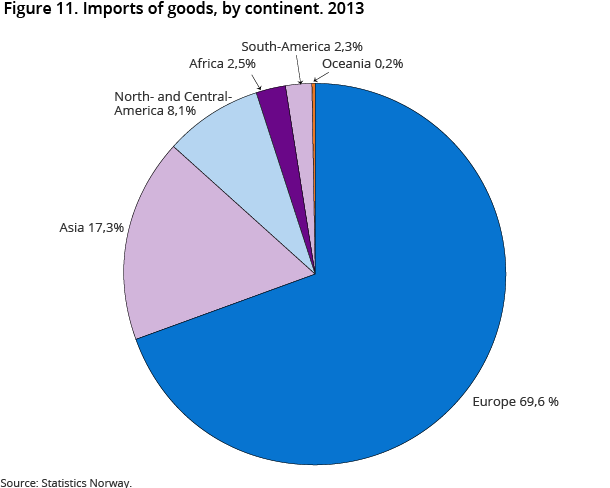
In 2013, Norway imported more from most parts of the world, except North and Central America and Africa. Imports of goods, excluding ships and oil platforms, from European countries reached NOK 364.4 billion; an increase of 4.1 per cent. From 2012 to 2013, imports from Asia also increased, but by just 2.8 per cent, while the increase from 2011 to 2012 was 7.8 per cent. In 2013, Asian imports came to NOK 84.5 billion. From North and Central America, imports amounted to NOK 41.7 billion in 2013; down NOK 2.3 billion from the previous year.
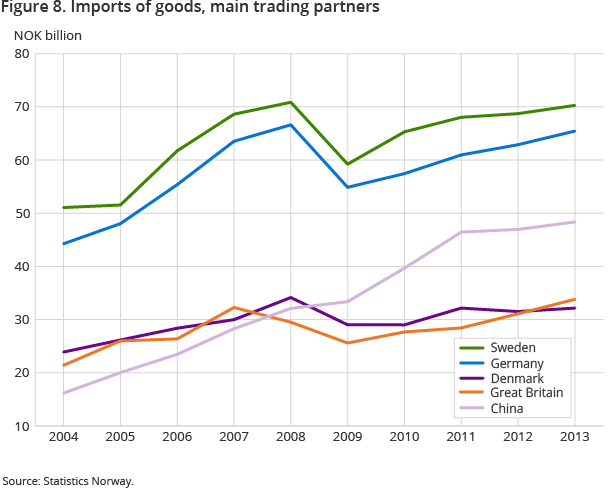
Sweden was our largest trading partner on the import side, and we received items for NOK 70.3 billion in 2013. The value was slightly higher than 2012. The main goods imported from our nearest neighbour were petroleum products and vehicles.
Our second largest trading partner on the import side was Germany. Compared with 2012, the import increased by 4.1 per cent, due to the car imports.
In 2013, Norway imported 200 707 vehicles in total, compared to 193 833 in 2012. The average car was more expensive in 2013 than in 2012.
China 2013: growth in import
Our third largest import country was China, which is still considered to be a developing country. The import growth we have seen for Chinese goods in recent years levelled off in 2012, but had a slight increase in 2013. China is still dominant among the Asian countries, but the country is also characterised by economic change – like most of the rest of the world – with the emphasis on a sustainable and independent economy. In 2013, the import from China grew less than normal for the last decade; by NOK 1.4 billion. The rise, when excluding ships, was NOK 1.4 billion, or 3.0 per cent.
In 2013, the commodity group containing computers shows a slight negative development, while the import value for the group with mobile phones increased. In addition, the import values for electrical machinery and manufactured goods were higher. Imports of clothing and shoes had a positive development in 2013, after a negative trend in 2012.
As in 2012, imports of the same goods from the new low-cost countries such as Vietnam, Cambodia, Indonesia and Malaysia increased in 2013, with Vietnam as the dominant country.
Changes in the external trade statistics for the years 2012 and 2013 Open and readClose
At 13 am on 16 May 2014, Statistic’s Norway’s website ssb.no will be updated with final figures for 2013 and corrected final figures for 2012, see table 26 for main changes .
The changes have also been made in Statbank .
National accounts and balance of payments will be revised for the years 2012 and 2013 in November 2014 and May 2014 respectively.
Change in country of destination for natural gas exportsOpen and readClose
Due to insufficient information about country of destination, changes have been made to the dissemination of the export figures for natural gas. From 2013, country of destination for these figures will be based on the landing point of the pipelines with gas from the Norwegian continental shelf.
Contact
-
Information services external trade
E-mail: utenrikshandel@ssb.no
-
Nina Rolsdorph
E-mail: nina.rolsdorph@ssb.no
tel.: (+47) 41 51 63 78
-
Jan Olav Rørhus
E-mail: jan.rorhus@ssb.no
tel.: (+47) 40 33 92 37
