Content
Published:
This is an archived release.
Record high imports
In 2013, imports totalled a record NOK 529.2 billion. Exports totalled NOK 899.7 billion. It was a peak year for the export of Norwegian fish, while revenues from the Norwegian continental shelf goods were reduced.
| NOK Million | Share in per cent | Change in per cent | |
|---|---|---|---|
| 2013 | 2013 | 2012 - 2013 | |
| Imports | 529 236 | 100.0 | 4.3 |
| Ships and oil platforms | 10 107 | 1.9 | 20.0 |
| Exports | 899 746 | 100.0 | -3.8 |
| Crude oil | 278 871 | 31.0 | -9.1 |
| Natural gas | 241 650 | 26.9 | -4.2 |
| Natural gas condensates | 8 249 | 0.9 | -23.5 |
| Ships and oil platforms | 6 380 | 0.7 | 11.4 |
| Mainland exports | 364 596 | 40.5 | 1.2 |
| The trade balance | 370 510 | . | -13.4 |
| The mainland trade balance | -154 533 | . | -11.1 |
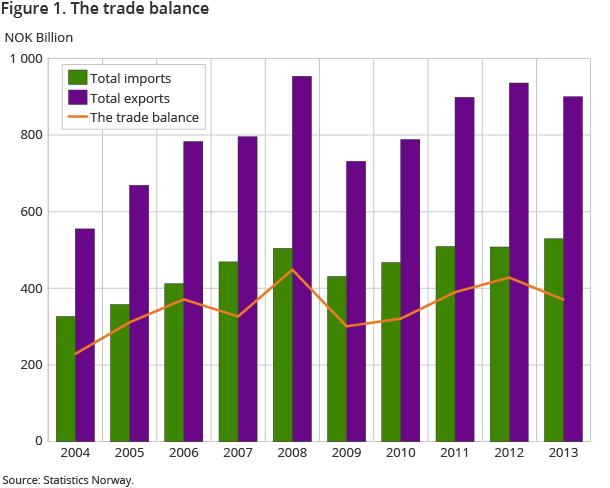
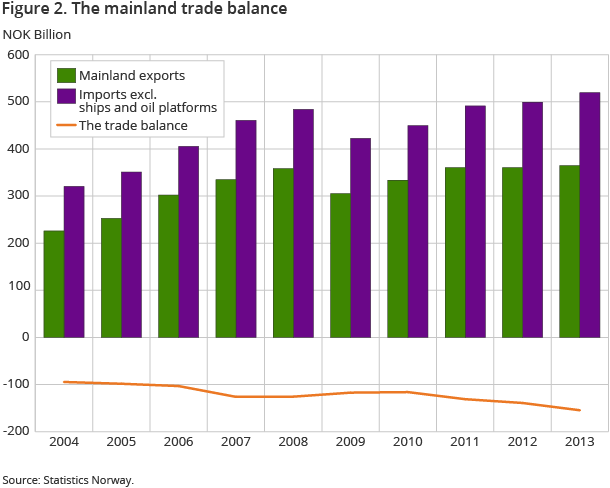
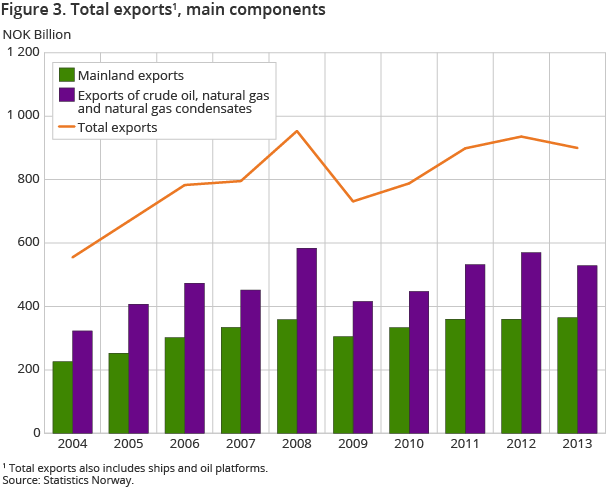
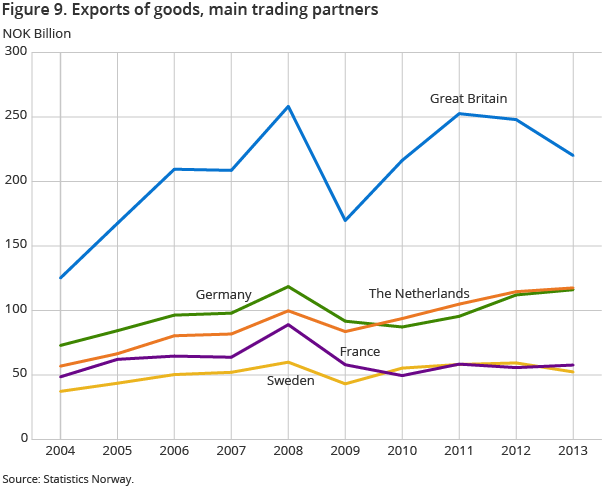
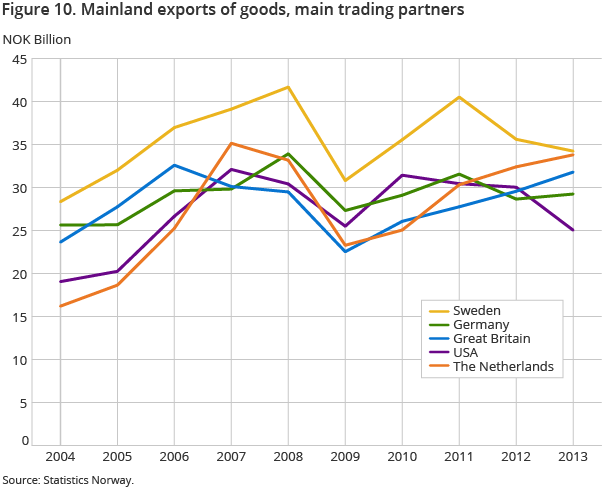
Preliminary figures for 2013 resulted in a trade balance of NOK 370.5 billion; NOK 58 billion less than one year earlier. The decline in the trade surplus is explained by an increase in imports of 4.3 per cent, while exports dropped 3.8 per cent. In 2013, mainland exports rose slightly by 1.2 per cent from the previous year. A lower income from the shelf commodities, crude oil and natural gas pulled down results.
Lower revenues from the shelf commodities
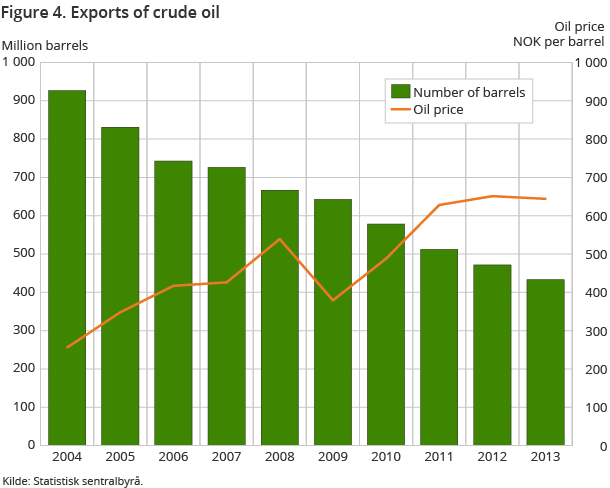
In 2013, the total export value of crude oil, natural gas and condensate reached NOK 528.8 billion. Of this, crude oil exports made up NOK 278.9 billion; a decline of 9.1 per cent and NOK 28 billion compared with the previous year. The decrease is due to a lower export volume, from 471 million barrels in 2012 to 433 million barrels in 2013, as well as a lower average price per barrel of crude oil, from NOK 651 in 2012 to NOK 644 in 2013.
Total export value of natural gas came to NOK 241.7 billion; a decrease of NOK 10.6 billion compared with the previous year. The export quantity of natural gas amounted to 104.7 billion standard cubic meters (Sm3) in 2013, compared with 109.5 billion Sm3 in 2012. However, if the developments in recent years continue, the export value of natural gas could surpass the level of crude oil exports within a few years.
Small growth in mainland exports
The year 2013 showed tentative signs of a positive economy in many parts of the world, including in Europe where our major trading partners are situated.
The export value of goods excluding ships, oil platforms, crude oil, natural gas and condensates amounted to NOK 364.6 billion in 2013; a slight increase of 1.2 per cent from the previous year.
In 2013, exports of machinery and transport equipment rose by 6.6 per cent and reached NOK 79.2 billion. Here, the largest sub-groups were other industrial machinery and equipment with NOK 19.2 billion, machinery specialised for particular industries with NOK 16.1 billion and electrical machinery and apparatus with NOK 14.3 billion.
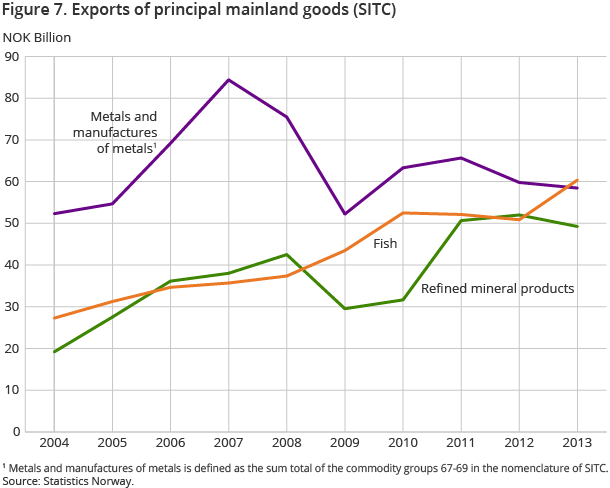
Export of manufactured goods ended at NOK 67.3 billion; a decline of 2.7 per cent compared with 2012. The export value of metals, excluding manufactures of metals, contributed to this decline and total export value amounted to NOK 47.4 billion; NOK 4.9 billion lower than in 2012. It was notably lower aluminium prices that contributed to the continued decline in 2013 - the price of aluminium has fallen since 2009. At the same time, the export of manufactures of metals showed a strong upswing of NOK 3.6 billion.
Record exports of fish
The export value of fish in 2013 reached a record high of NOK 60.4 billion. This was as much as NOK 9.6 billion, or 18.8 per cent more than the year before.
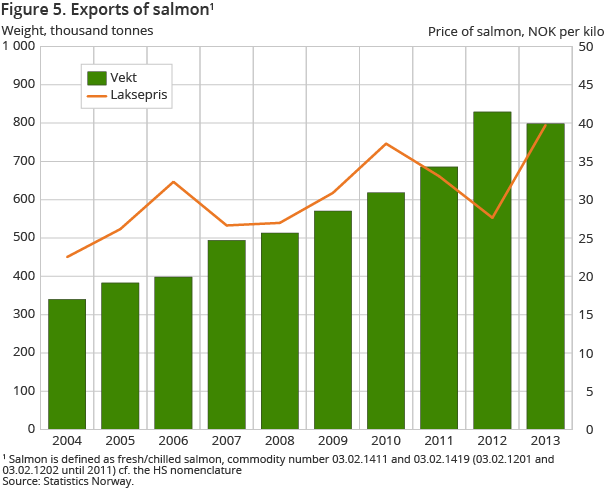
It was fresh whole salmon in particular that ensured record exports in 2013. This export alone accounted for over half of exports and came to NOK 31.6 billion. The exported volume of this product fell however by 3.4 per cent to 796 400 tonnes. The lowest weekly average price per kg in 2013 was NOK 30, and for the year as a whole ended at a substantial NOK 40 per kg compared to NOK 28 for 2012.
Our main export market for salmon in 2013 was still Europe, with countries like France and Russia. In the same period, our export of salmon to the Asian market increased. Exports to Vietnam more than doubled, while exports to Hong Kong and China fell.
Moreover, exports of cod, herring and mackerel were worth NOK 5.8, NOK 3.2 and NOK 2.9 billion respectively.
Record high imports
In 2013, we imported goods excluding ships and oil platforms at a value of NOK 519.1 billion, representing a 4 per cent increase, or NOK 19.9 billion, compared with the previous year.
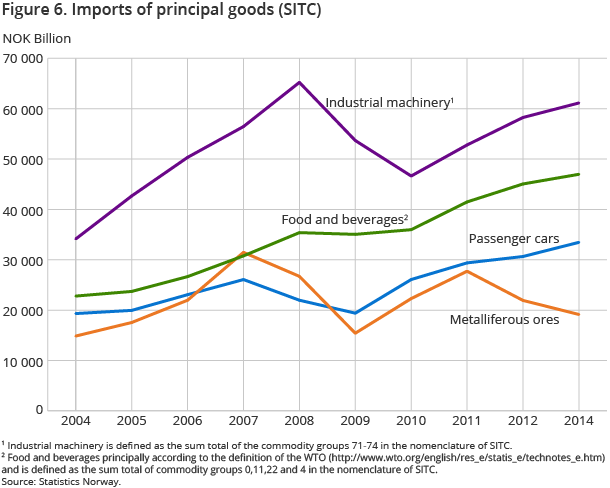
The majority of the imports in 2013 were within the main group machinery and transport equipment with an import value of NOK 205.8 billion; an increase of 6.1 per cent or NOK 11.9 billion. Here we find sub-groups like road vehicles, other industrial machinery and electrical equipment, and the import value totalled NOK 54.9 billion, NOK 29.2 and NOK 27.4 billion respectively. In 2013, passenger car imports came to a record high NOK 33.5 billion, with more than 200 700 cars. Thus, we imported more cars and more expensive cars to Norway in 2013. Norway still imported most cars from Germany - over 68 500, but the percentage is lower than the year before. The share of Japanese and South Korean cars, however, increased from 2012 to 2013. We also see a rising trend in the share of imports of electric vehicles compared to earlier. Last year we also imported more mobile phones and more expensive mobile phones, with a total of 2.9 million phones worth NOK 6.6 billion. The imports of mobile phones together with imports of PCs and tablets are enough to provide the entire Norwegian population with a new product in 2013.
Small growth in mainland exports to Europe
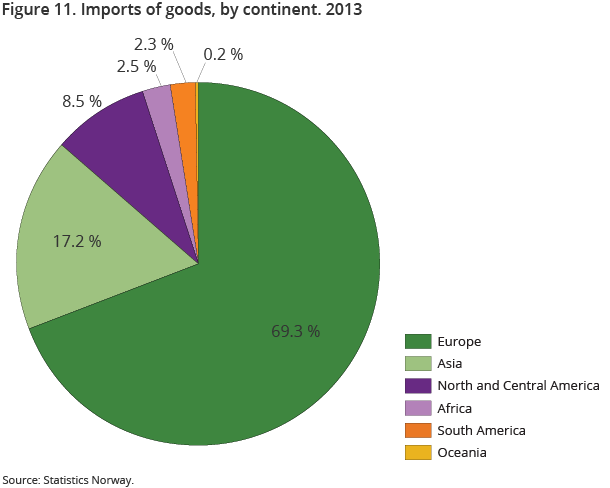
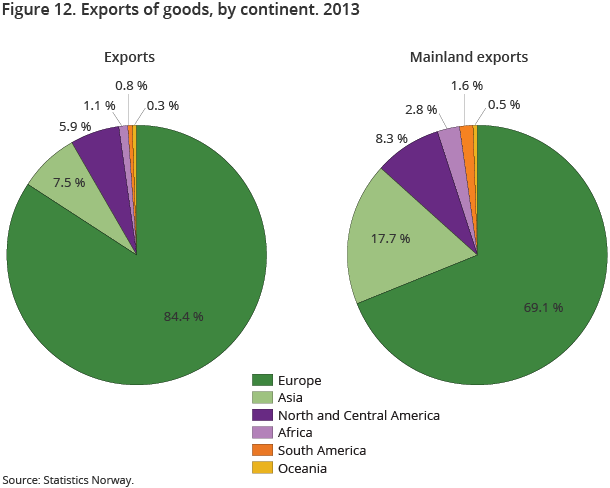
Mainland exports excluding ships and oil platforms to Europe showed a slight increase of 1.1 per cent from 2012 to 2013, and totalled NOK 251.8 billion. Both the import and export share of trade with European countries accounted for approximately 70 per cent of our external trade in 2013 and is thus our most important trading area. Among the European countries, we export the most to Sweden, although the value was lower than the previous year, in addition to the Netherlands, the UK and Germany in 2013.
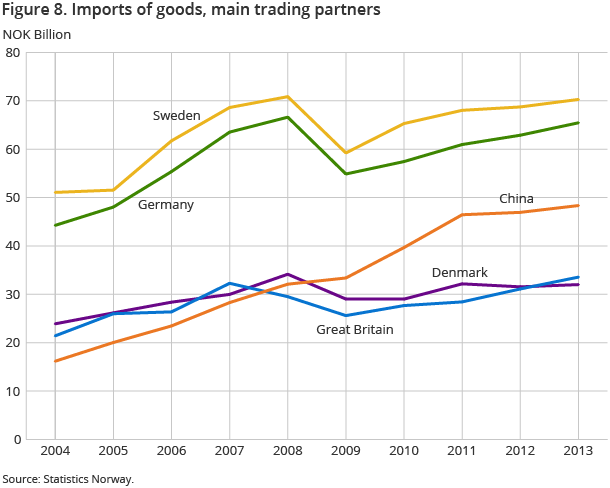
Imports of goods excluding ships and oil platforms from European countries amounted to NOK 364.2 billion in 2013 - up 4 per cent from the previous year. The countries we imported the most from were Sweden, Germany, UK and Denmark. Countries previously affected by the financial crisis, such as Spain and Italy, imported as much in 2013 as in 2012. At the same time, trade imports and exports with Germany, UK and France increased.
Global mainland trade
After Europe, Asia was our largest trade area. In 2013, the exports to Asian countries came to NOK 64.5 billion; an increase of NOK 6.3 billion compared with the previous year. Imports for their part rose by NOK 2.3 billion and ended at NOK 84.6 billion. Both trade flows with Asian countries accounted for about 16 per cent of our total imports and exports. China was the Asian country we traded by far the most with in 2013. From China, we imported various items of machinery and clothing, while we exported seafood and machinery. In addition, we saw an increase in both imports and exports to South Korea and Singapore.
Our third largest trading area was North America, which in 2013 accounted for about 8.5 per cent of our foreign trade. Imports from this region increased by NOK 160 million and reached NOK 44.2 billion. Exports declined by NOK 5.6 billion and ended at NOK 30.3 billion from 2012 to 2013. Mainland exports to the USA have remained stable at around NOK 30 billion since 2010. However, in 2013 the same export dropped to NOK 25 billion, which is lower than after the financial crisis and clearly reflects a tight economic situation. Although fish exports to the USA increased in 2013, lower exports of refined petroleum products pulled total exports to the USA down.
Trade with African countries rose in 2013. Imports from this continent totalled NOK 13.2 billion - up NOK 4.5 billion compared with the previous year. Exports rose by NOK 1.7 billion to NOK 10.2 billion. We imported the most from South Africa and Botswana, while our exports mainly went to Angola and South Africa.
This page has been discontinued, see External trade in goods, Monthly and External trade in goods, Annually.
Contact
-
Information services external trade
E-mail: utenrikshandel@ssb.no
-
Nina Rolsdorph
E-mail: nina.rolsdorph@ssb.no
tel.: (+47) 41 51 63 78
-
Jan Olav Rørhus
E-mail: jan.rorhus@ssb.no
tel.: (+47) 40 33 92 37
