Content
Published:
This is an archived release.
Trade surplus increased sharply
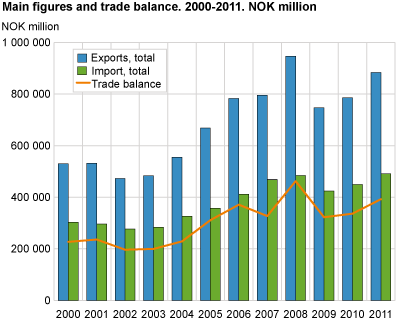
In 2011, we exported goods, excluding ships and platforms, amounting to a value of NOK 883.6 billion, while we imported for NOK 491.1 billion. This resulted in a trade surplus of NOK 392.6 billion – an increase of 17 per cent from 2010. With the exception of 2008, this was the highest trade surplus ever recorded.
Figures for December 2010 and a table showing the main figures for the year 2011 are available here. |
The preliminary yearly figures showed that the trade balance improved by NOK 56 billion compared to the previous year. The trade surplus increase was due to the fact that the exports rose more than the imports; by 12 and 9 per cent respectively. Higher mean prices for crude oil in 2011 than 2010 was the factor with the largest influence on the rising export values, however mainland exports also increased.
Increased exports of oil
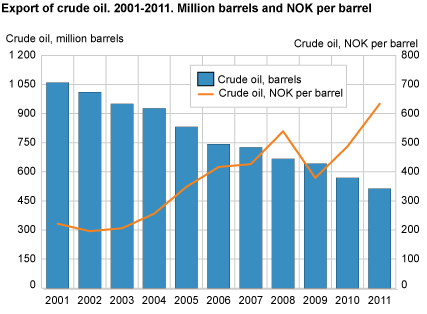
In 2011, the total export value of crude oil, natural gas and condensates came to NOK 524.2 billion. The export value of crude oil alone was NOK 325.1 billion; an increase of almost NOK 48 billion, or 17 per cent compared to 2010. The positive development was mainly due to higher crude oil prices. The average crude oil price went up NOK 146, from NOK 487 per barrel in 2010 compared to NOK 634 per barrel in 2011. On the other hand, the number of exported barrels of crude oil declined in 2011, from 569 million barrels in 2010 to 513 million barrels.
The quantity of exported natural gas in gaseous state decreased from 97.4 billion cubic metres in 2010 to 94.2 billion in 2011. The total exported value of natural gas ended at NOK 190.8 billion; an increase of NOK 22.2 billion compared to last year.


Continued growth for mainland exports
Preliminary figures showed that so far the turbulence in the world economy has not significantly influenced mainland exports. The total export value for goods excluding ships, oil platforms, crude oil, natural gas and condensates, came to NOK 359.5 billion in 2011. This was NOK 25.8 billion more than in 2010; equivalent to growth of almost 8 per cent.
We exported refined mineral oil products amounting to NOK 50.6 billion in 2011. This was an increase of 60 per cent compared to 2010. The rise could largely be attributed to low production levels at the Kårstø and Mongstad refineries in 2010 due to planned maintenance.
The export of chemical products came to NOK 45.8 billion for 2011. This was an increase of 2 per cent compared to 2010. Of the subgroups, only “other chemical products” showed a decline. The total value of NOK 23.3 billion in 2011 was NOK 1.4 billion lower than in 2010.
The export of manufactured goods in 2011 amounted to NOK 76.5 billion; an increase of 2 per cent compared to 2010. We exported paper and cardboard for NOK 6.2 billion; a decrease of 7 per cent compared to the previous year. At the same time, more metals were exported in 2011. For the groups iron and steel and non-ferrous metals, the combined value was NOK 59 billion. This was an increase of NOK 3.1 billion compared to 2010, which was partly due to higher metal prices in 2011.
The export value of fish on par with record year 2010
In 2011, fish exports totalled NOK 51.7 billion. After seven years of continuous growth, fish exports went down NOK 630 million or 1.2 per cent compared with 2010. As in previous years, Russia and France were the most important markets for Norwegian fish.
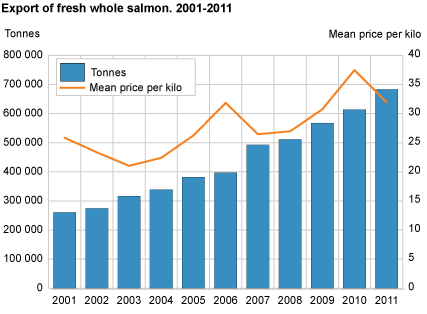
The most important fish product was fresh farmed whole salmon. In 2011, the export amounted to NOK 21.8 billion and accounted for 42 per cent of the total fish exports. Despite all time high export volumes of 683 thousand tonnes, the export value went down NOK 1.2 billion compared to 2010. This was due to lower salmon prices in 2011. By comparison, the average price per kilo was NOK 32 in 2011 and NOK 37.5 in 2010.

Exports of mackerel and herring increased. The export of frozen mackerel reached an all time high of NOK 3.1 billion in 2011; an increase of NOK 552 million from 2010. Frozen herring fillets went up NOK 573 million to NOK 1.7 billion in 2011.
Increased imports
We imported goods, excluding ships and oil platforms, for NOK 491.1 billion in 2011; an increase of 9 per cent from 2010. Imports grew for most commodity groups in 2011.
Machinery and transport equipment was the largest commodity group for imports, amounting to NOK 178 billion for 2011. This was NOK 16 billion more than in 2010, equivalent to a 10 per cent growth. The subgroups with the largest increases were machinery for special industries, road vehicles and other transport equipment. In 2011, we imported 195 000 passenger cars, which was almost 12 000 more than in 2010 and on a par with the record level in 2007.
Imports of electric current sank in 2011, amounting to NOK 5.1 billion, down from NOK 6.2 billion in 2010. Similarly, the group medicinal and pharmaceutical products declined, with a value of NOK 10.8 billion in 2011; 4 per cent less than in 2010. Unusually high levels of imports in 2010 were the main cause of both declines.
Growth in mainland exports to Europe – decline to Asia
Europe continues to be Norway’s most important trade region. Trade with EU countries amounted to 65 per cent of all imports excluding ships and oil platforms, and 63.3 per cent1 of mainland exports in 2011. The import value of NOK 317.6 billion represented an increase of 8 per cent compared to 2010. Sweden and Germany were the countries we received most goods from, followed by Denmark and Great Britain.
Mainland exports came to NOK 228.7 billion in the same period – a year-on-year growth of 12 per cent1. Similar to imports, our most important export markets were Sweden and Germany, followed by the Netherlands and again Great Britain. If commodities from the continental shelf are included, Great Britain is first, followed by the Netherlands and Germany. Mainland exports to all European countries, except crisis hit Greece, Italy, Portugal and Spain, grew in 2011.
Trade with Asian countries accounted for about 16 per cent of imports and 15 per cent of exports. While the imports increased by 12 per cent and ended at NOK 78 billion, exports fell by almost 10 per cent to a total of NOK 52.1 billion. China dominated imports, explaining most of the growth for the trade region with an increase of NOK 5.5 billion. However, trade with Japan and South Korea also rose by almost NOK 1 billion for each country. The fall in exports was to a large degree due to the decline in machinery exports to South Korea and Singapore. In comparison, exports to China grew by over 4 per cent.
Both imports and exports to the countries in North America amounted to just above 10 per cent of Norway’s total external trade. The 2011 imports came to NOK 50 billion and exports NOK 38.7 billion – equalling growth of 17 and 6 per cent respectively compared to 2010. A sharp increase in the purchase of metalliferous ores and metal scrap from Canada was the main reason behind the import increase. While exports to Canada doubled compared to 2010, due to higher trade with refined mineral oil products, it fell somewhat to the USA.
Brazil is our most important trade partner in South America. The imports of NOK 7.6 billion entailed growth of nearly 20 per cent. Metalliferous ores and scrap, coffee and various foodstuffs increased the most. The exports amounting to NOK 4.8 billion showed a fall of close to 17 per cent. In particular, the reduction in trade with propane and butane together with machines was a decisive factor.
Imports from African countries grew somewhat in 2011. However, the total value of NOK 9.1 billion only accounted for less than 2 per cent of the total external trade. Norway’s export to this continent totalled NOK 7 billion, which was a decrease compared to 2010. Trade with Oceania is marginal, representing only 0.2 per cent of imports and 0.5 per cent of exports.
Tables
- Table 4 Exports, selected commodity groups, 2010-2011. NOK billion
- Table 5 Imports, selected commodity groups, 2010-2011. NOK billion
1 Corrected 16 January 2012 at 10.15
This page has been discontinued, see External trade in goods, Monthly and External trade in goods, Annually.
Contact
-
Information services external trade
E-mail: utenrikshandel@ssb.no
-
Nina Rolsdorph
E-mail: nina.rolsdorph@ssb.no
tel.: (+47) 41 51 63 78
-
Jan Olav Rørhus
E-mail: jan.rorhus@ssb.no
tel.: (+47) 40 33 92 37
