Content
Published:
This is an archived release.
Social background impacts results
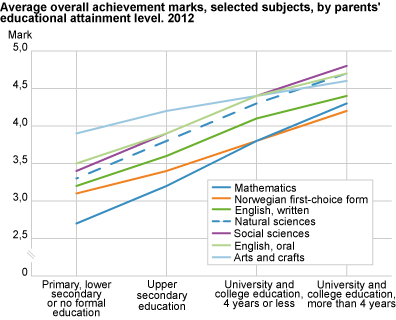
The marks of pupils that completed lower secondary education in 2012 vary significantly in relation to both gender and social background. Differences associated with parental level of education are most evident in theoretical subjects.
An obvious positive relation can be observed between pupils’ school results and their parents’ level of education. On average, the number of attained school points ranged from 33.8 points for pupils whose parents had the least education, to 45.7 points for pupils whose parents had long tertiary education. The differences related to social background are least evident in practical subjects like food and health, arts and crafts and physical education, and most evident in theoretical subjects. The biggest differences are found in mathematics. The average overall achievement mark in mathematics for pupils whose parents had the least education is 2.7, and the corresponding figure for pupils whose parents had tertiary education is 4.3.
Girls achieve higher marks than boys
Results in lower secondary schools vary across the different subjects. While the average overall achievement mark is 4.4 in food and health and physical education, it is almost one mark lower in mathematics, where it is 3.5. On average, the marks in written examinations are lower than the overall achievement marks for the same subject, whereas the opposite is the case for marks in oral examinations. In general, girls achieve better results than boys in all subjects, apart from physical education. This gender difference is also evident in the attainment of lower secondary school points, where boys on average get 38 points and girls get 42 points. The average for all pupils is 40 school points.
Small differences among the counties
The difference in lower secondary school points varied less among the counties than among genders. The difference among the counties with the highest and lowest values in 2012 was 2.7 points. In Akershus, Oslo, Hordaland, and Sogn and Fjordane the average was around 41 school points, while the corresponding figure for Finnmark was 38.5.
Differences between pupils in public and private schools
Pupils who attend private schools have higher average overall achievement marks in English, mathematics and first choice form of Norwegian than pupils who attend public schools. In English and first choice form of Norwegian, the average overall achievement mark for pupils in private schools is 4.3 and 4.2 respectively, compared to 3.9 in mathematics. The same figures for pupils in public schools are 3.9 and 3.8 in English and first choice form of Norwegian respectively, and 3.5 in mathematics. These differences appear to be smaller in written examinations. The average result for pupils in private schools is 4.1 in the English written examination, 3.6 in the first choice form of Norwegian examination and 3.4 in the mathematics examination, while pupils in public schools average 3.8 in the English examination, 3.4 in the examinations in first choice form of Norwegian and 3.5 in mathematics.
The differences in the results of pupils in private schools and pupils in public schools are least significant within the group of children whose parents have tertiary education. Children of parents without tertiary education on average attain somewhat higher marks in private schools than in public schools.
Immigrant pupils score lower than other pupils
On average, immigrants get lower marks than other pupils. The difference is most apparent in first choice form of Norwegian and written English, where immigrant pupils’ average overall achievement mark is 3.2 and 3.3 respectively, compared to an average of 3.9 for pupils whose parents are not immigrants. Norwegian-born pupils to immigrant parents score higher than immigrant pupils on average, but slightly lower than other pupils. The differences between the three immigration categories are smallest in second choice form of Norwegian, where immigrants’ average overall achievement mark is 3.3, compared to 3.5 for Norwegian-born pupils to immigrant parents and other pupils.
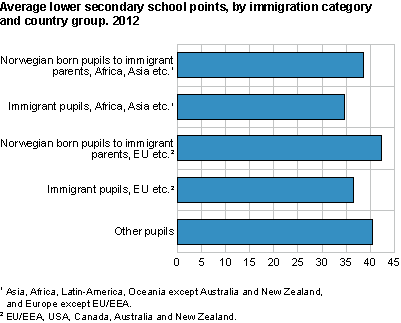
There are pronounced variations in the average marks of pupils with different country backgrounds within the two groups “immigrant pupils” and “Norwegian-born pupils with immigrant parents”. It is particularly immigrant pupils and Norwegian-born pupils to immigrant parents from country group 21 who attain fewer school points than other pupils.
Marks compared with national tests
The marks the pupils attain when they complete lower secondary school reflect, to a certain degree, the results the same pupils achieved in national tests in 8th grade. Close to 80 per cent of the pupils who achieved the lowest mastering level in mathematics in 8th grade attained 1 or 2 in mathematics overall achievement. Similarly, 80 per cent of the pupils who achieved the highest mastering level in mathematics in 8th grade attained 5 or 6 in mathematics overall achievement. In contrast, close to half of the pupils who achieved the lowest mastering level in reading Norwegian in 8th grade attained 3 in first choice form of Norwegian overall achievement.
|
Lower secondary school points can be viewed as a combined measurement for all marks. The lower secondary school point score summarises the pupil’s results in all the different subjects, and is part of the admission criteria for upper secondary school. A pupil’s school points are calculated by adding up each individual mark attained (overall achievement or examination), represented by numbers. This outcome is then divided by the number of marks, resulting in an average mark. The final score is calculated by multiplying this average, with two decimals, by 10. If the pupil has attained marks in less than half of his/her subjects, the lower secondary school point score is set to zero. Pupils with zero school points are not included in these statistics. |
1Country group 1= EU/EEA, USA, Canada, Australia and New Zealand. Country group 2 = Africa, Latin-America, Oceania except Australia and New Zealand, and Europe except EU/EEA.
Tables:
- Table 1 Average lower secondary school points, by gender, county and parents' educational attainment level. 2012
- Table 2 Average overall achievement marks, selected subjects, by gender and parents' educational attainment level. 2012
- Table 3 Average examination marks, selected subjects, by gender and parents' educational attainment level. 2012
- Table 4 Average overall achievement marks, selected subjects, by immigration category. 2012
- Table 5 Average examination marks, selected subjects, by immigration category. 2012
- Table 6 Average lower secondary school points, by immigration category, country group and gender. 2012
- Table 7 Average overall achievement marks and examination marks, selected subjects, by school ownership and parents' educational attainment level. 2012
- Table 8 Distribution of overall achievement marks in Mathematics, English and Norwegian, by mastering levels on national tests in 8th grade in 2009. 2012. Per cent
Contact
-
Rachel Ekren
E-mail: rachel.ekren@ssb.no
tel.: (+47) 95 83 89 67


