Content
Published:
This is an archived release.
Decrease in R&D after several years of growth
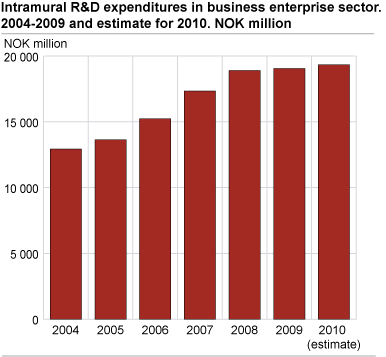
Preliminary figures show that Norwegian business enterprises spent about NOK 19.1 billion in research and development (R&D) expenditure in 2009. It is the same level as 2008 in nominal terms, but it is a decrease of 3.1 per cent in fixed prices. The number of performed R&D man-years decreased by 2.6 per cent.
After four years with marked growth of R&D activity in business enterprises, this trend is broken in 2009. The results for 2009 coincide well with the enterprises’ estimates for 2009 published at same the time last year. The estimates are usually lower than the actual results measured in retrospect. The business enterprise sector does not expect any growth in 2010 either. The estimates made by the enterprises in the second quarter of 2010 indicate a weak increase of 1.5 per cent in R&D expenditure and an unchanged number of performed R&D man-years.
The number of performed R&D man-years decreased by 2.6 per cent in 2009 compared with 2008. There were in total almost 23 900 persons involved in R&D activity in 2009; approximately the same level as in 2008.
Increase in compensation of employees and decrease in investments
Of the R&D expenditure, the compensation of employees increased for the business enterprise sector, as a whole, despite reduction in performed R&D man-years. The compensation of employees make up NOK 12.5 billion in 2009, and is the biggest expenditure component with 66 per cent of total R&D expenditure. The compensation of employees increased by 4 per cent from 2008, but the average costs for compensation of employees have increased by 7 per cent. Other current costs have remained relatively stable. However, investments in buildings and machinery have decreased markedly by NOK 355 million to in excess of NOK 1 billion. The investments account for 5 per cent of total R&D expenditure, a decrease by 1.9 percentage points compared with 2008. Investments in buildings and machinery can vary some from year to year.
Decrease in both manufacturing and service industries
Both service industries and manufacturing industries have approximately unchanged R&D expenditure in 2009 compared with 2008 in nominal terms. The service industries have had considerable growth the recent years. When grouped by number of employees, all classes of enterprises have about the same development.
The number of performed R&D man-years was reduced with 2.7 per cent in service industries and 3.8 per cent in manufacturing industries. Other industries1(including extraction of petroleum and gas) increased the number of R&D man-years with 6 per cent. The total number of persons involved in R&D activity also increased in these other industries.
Increased share of GDP despite decrease in R&D expenditure
Despite weak development in R&D expenditure in business enterprise sector, these expenditures nevertheless increased measured as share of GDP, from 0.75 to 0.8 per cent. This is especially the result of the reduction in the contribution to GDP from extraction of petroleum and gas. The R&D expenditure’s share of gross product on the mainland of Norway weakly decreased from 1.22 to 1.19 per cent.
About the dataThe R&D statistics are based on information collected from the enterprises. All enterprises with 50 employees or more are included. In addition, a sample of enterprises with 10-49 employees is drawn and total figures for this group are calculated based on this sample. As a result, there is greater uncertainty surrounding the results for the small enterprises. In the preliminary figures, complete entries from some large R&D actors are missing, and the entries for these enterprises are therefore estimated. |
1 These other industries include the industries Mining and quarrying, Electricity and gas supply, Water supply, sewerage, waste, Construction, and Fishing and aquaculture.
Tables:
- Table 1 R & D in Business Enterprise Sector. Intramural R & D, R & D-personnel and R & D man-years, by Industry and size class. 2007, 2008 and 2009. NOK millon and number of
- Table 2 R & D in Business Enterprise Sector. Intramural and extramural R & D, R & D personell and man-years by Industry. 2008 and 2009. NOK million and number of
- Table 3 Intramural R & D expenditures in Business Enterprise sector, by Industry and size class. 2009. NOK million
Find more figures
Find detailed figures for Research and development in the business enterprise sector
Contact
-
Kristine Langhoff
E-mail: kristine.langhoff@ssb.no
tel.: (+47) 40 90 24 39
-
Claudia Berrios
E-mail: claudia.berrios@ssb.no
tel.: (+47) 40 90 24 51
-
Harald Fondevik
E-mail: harald.fondevik@ssb.no
tel.: (+47) 40 90 24 47

