Content
Published:
This is an archived release.
More petroleum-related R&D
Norwegian enterprises (with at least 5 employees) performed R&D for NOK 22.9 billion in 2012 according to final figures. There has been an annual increase of 7 per cent since 2010. In fixed prices, the growth is 3 per cent annually. The growth from 2011 has been especially large in the petroleum industry.
| 2012 | 2011 - 2012 | ||
|---|---|---|---|
| Level | Percentages | Change in per cent | |
| Intramural R&D expenditure (NOK million) | 21 176.3 | 100 | 5.5 |
| Industry | |||
| Manufacturing | 8 066.3 | 38 | 4.0 |
| Services total | 10 862.8 | 51 | 3.7 |
| Extraction of crude petroleum and natural gas | 1 580.6 | 7 | 31.8 |
| Other industries | 666.6 | 3 | 4.8 |
| Size of enterprise | |||
| 10-49 persons employed | 5 083.1 | 24 | 13.6 |
| 50-99 persons employed | 2 313.6 | 11 | 4.9 |
| 100-199 persons employed | 2 898.0 | 14 | -15.5 |
| 200-499 persons employed | 2 108.7 | 10 | 7.2 |
| 500 persons employed and more | 8 772.9 | 41 | 9.8 |
| R&D man-years (number of) | 16 062 | 3.3 | |
| Extramural R&D expenditure (NOK million) | 5 934.7 | 10.1 | |


A total of 28 100 employees were involved in R&D in the business enterprise sector (enterprises with at least 5 employees), and these employees performed a total of 17 700 R&D man-years. This means that every person who was involved in R&D activities performed on average 0.63 R&D man-years. On average, more R&D work is performed per person in large enterprises than small enterprises. For enterprises with 5-9 employees, the corresponding figure is 0.49, while in enterprises with at least 500 employees, 0.77 man-years were performed per R&D person.
Women in research
In recent years, women constituted 21 per cent of R&D personnel in the business enterprise sector. However, manufacturing and service industries have developed in different directions since 2007. For the manufacturing sector, there has been an increase of 4 percentage points, while service industries had a reduction of 2 percentage points. Some industries stand out with a particularly high share for women. In the pharmaceutical industry, 60 per cent of R&D staff were women in 2012 and in the food products and beverage industry the share of women was 45 per cent.
R&D growth for extraction of petroleum and gas
Manufacturing and service industries are performing most of the R&D activity in the business sector, and both main industries increased by 4 per cent from 2011 (enterprises with at least 10 employees). Other industries had also increased, and it is mainly extraction of crude petroleum and natural gas that accounted for this growth, with an increase of NOK 380 million or 32 per cent.
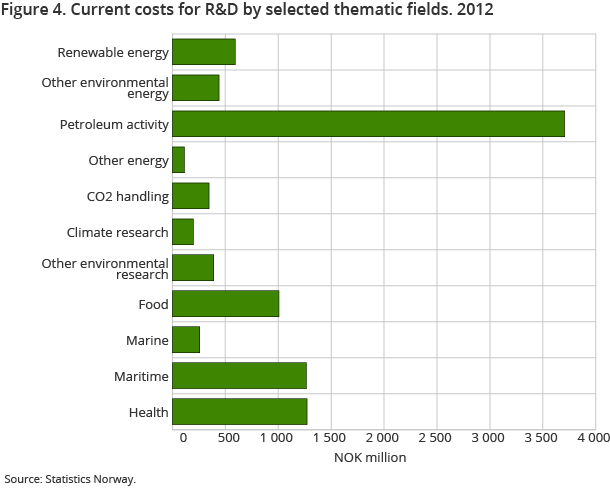
There are also many other industries that have petroleum-related R&D. Current costs to petroleum-related R&D amounted to NOK 3.7 billion in 2012. Of this, extraction of crude petroleum and natural gas accounted for NOK 1.4 billion, with the remainder emanating from manufacturing industries such as machinery and equipment, building of ships and boats, and service industries such as engineering activities.
Business enterprises performed maritime-related R&D for NOK 1.3 billion. This research is aimed at maritime operations, also associated to oil and gas activities. There is an increase of NOK 360 million, spread over several industries in manufacturing and services.
Buying more R&D services from others
Compensation of employees in 2012 accounted for 64 per cent of total R&D expenditure in business enterprises. Beyond the effort that enterprises' own employees perform, the enterprises also hire staff from outside. In 2012, costs for hired R&D personnel amounted to NOK 1.7 billion. Salaries and costs for hired personnel totalled NOK 15.4 billion, i.e. 73 per cent of total R&D expenditure. The service sector is by far the most labour intensive, with 78 per cent of R&D expenditure related to salaries and hired staff. The corresponding share in the manufacturing industries is 66 per cent.
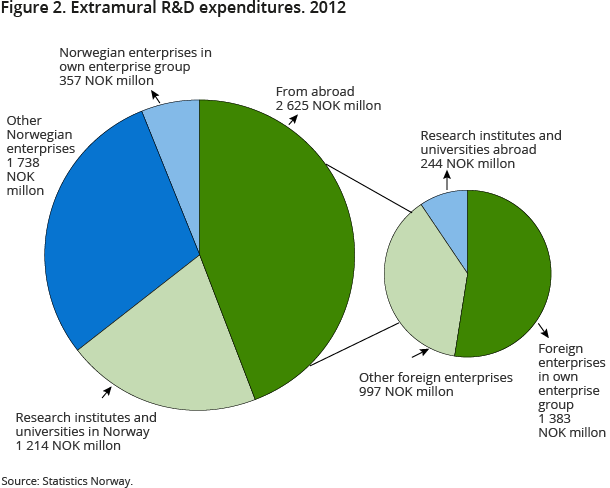
In addition to the intramural R&D, the enterprises acquired R&D services carried out by others for NOK 5.9 billion in 2012, about NOK 500 million more than the year before. There has been significant growth for large enterprises with at least 200 employees.
The business sector acquired R&D services from other Norwegian enterprises for NOK 1.7 billion in 2012. Purchases from other foreign enterprises are somewhat less common, accounting for NOK 1 billion. The enterprises also purchased R&D services from enterprises in their own enterprise group, mainly from abroad. Acquisitions from foreign enterprises in their own enterprise group constituted NOK 1.4 billion. Research institutes and universities in Norway are also important suppliers of R&D services to the business enterprise sector, and amounted to NOK 1.2 billion.
Most internal funding of R&D
Most of the intramural R&D expenditure in business enterprises is financed by the enterprises' own funds, which accounted for 75 per cent of total funding. In addition, some R&D is funded by own enterprise group. Five per cent of R&D expenditure is funded by Norwegian enterprises in their own enterprise group, and 9 per cent is funded by foreign enterprises in their own enterprise group. Enterprises reported NOK 980 million in public funds for R&D, or 5 per cent of total funding. This is NOK 200 million more than in 2011.
Uncertainty of the resultsOpen and readClose
R&D statistics are based on information collected from the enterprises. All enterprises with 50 employees or more are included. In addition, a sample of enterprises with 10-49 employees is drawn and total figures for this group are calculated based on this sample. As a result, there is greater uncertainty surrounding the results for the small enterprises.
Find more figures
Find detailed figures for Research and development in the business enterprise sector
Contact
-
Kristine Langhoff
E-mail: kristine.langhoff@ssb.no
tel.: (+47) 40 90 24 39
-
Claudia Berrios
E-mail: claudia.berrios@ssb.no
tel.: (+47) 40 90 24 51
-
Harald Fondevik
E-mail: harald.fondevik@ssb.no
tel.: (+47) 40 90 24 47
