Content
Published:
This is an archived release.
Large differences in GDP and price levels
Luxembourg and Norway continued to have Europe’s highest price level adjusted GDP per capita in 2009. There are still large differences between the European countries in terms of both GDP and price levels.
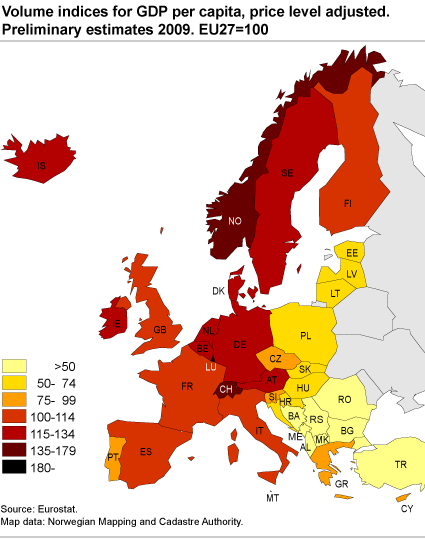
Luxembourg and Norway were prominent among the European countries with the highest price level adjusted GDP per capita in 2009. Switzerland and the Netherlands also had high results. Price level adjusted GDP per capita in Denmark and Sweden was about 35 per cent below Norway.
Still there are large differences between the eastern and the western European countries. Among the 12 countries joining the EU since 2004, only Cyprus, Slovenia, Czech Republic and Malta are close to the GDP level in Western Europe. At the bottom of the list are the Serbian Republic, The Former Yugoslav Republic of Macedonia, Bosnia-Herzegovina and Albania are. Price level adjusted GDP per capita in Luxembourg is about 10 times as high as in Albania.
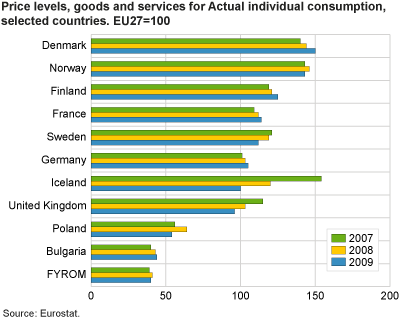
Denmark with Europe’s highest price level, Iceland with considerable drop
The price level in Denmark for Actual Individual Consumption was Europe’s highest in 2009, 50 per cent above the average price level of the 27 EU countries (EU27). Norway and Switzerland followed, with price levels about 40 per cent above EU27.
Sweden had a somewhat lower price level for Actual Individual Consumption, much the same level as France, Austria, Netherlands, Italy and Germany. The cheapest European countries are situated in Southeast Europe. In Albania, Serbian Republic, Bulgaria and The Former Yugoslav Republic of Macedonia, the price levels for goods and services are below half of the European average.
In 2007, Iceland was Europe’s most expensive country, with a price level 50 per cent above the European average. In 2009, the situation is considerably different, with an Icelandic price level precisely at the European average. United Kingdom has experienced a similar development. In 2007 the price level in United Kingdom was 15 per cent above the European average. In 2009 the price level has decreased to 4 per cent below the EU27. For both countries the reason behind this is a strong depreciation of the Icelandic króna and the British Pound Sterling respectively.
|
The indices in tables/charts are expressed in relation to the average level of the 27 EU member states (EU27=100). As an example, if the index for a country’s GDP, Actual Individual Consumption or price level is 120, this means that the country’s level is 20 per cent higher than the average of the 27 EU member countries. |
Further reading in Eurostat’s “ Statistics in Focus ”.
Tables:
This page has been discontinued, see Comparison of price levels in Europe, Annually.
Additional information
Contact
-
Birte Larsen Sandstå
E-mail: birte.sandsta@ssb.no
tel.: (+47) 92 60 56 03
-
Hamdi A. Mohamed
E-mail: hamdi.mohamed@ssb.no
tel.: (+47) 46 81 54 76
-
Norway-ppp@ssb.no
E-mail: norway-ppp@ssb.no