Content
Published:
This is an archived release.
High GDP per capita for Luxemburg and Norway
Luxemburg and Norway had the highest gross domestic product (GDP) per capita in Europe in 2008, adjusted for price level differences. Norway’s volume of actual individual consumption and price levels remains high compared to the 27 member countries of the EU.
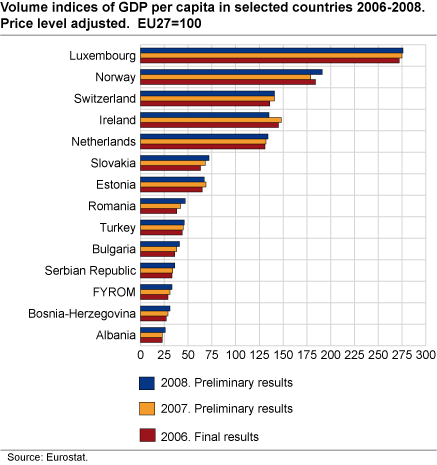
Switzerland, Ireland and the Netherlands joined Luxemburg and Norway as the top five countries in terms of GDP per capita in 2008. Norway’s relative GDP per capita increased compared to the preceding year, again trailing Luxemburg. Following Norway is Switzerland, bumping Ireland out of third place in 2008, due to the decline in Ireland’s GDP. Countries basically retained their relative positions from 2007 to 2008, with some exceptions. An interesting trend was observed from 2006-2008; for traditionally strong economies there were slight relative GDP per capita decreases, while there were noticeable relative increases for the emerging economies. Relative GDP increases were remarkably strong for the Western Balkan countries and new member countries Slovakia and Romania, though GDP levels per capita for the Western Balkan countries were still below 50 per cent of the EU27 average.
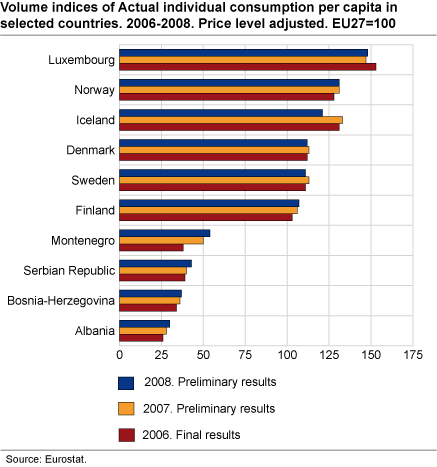
Wide range of volume of Actual Individual Consumption per capita in 2008
The volume of Actual Individual Consumption (AIC) per capita in 2008 for Europe ranged from 148 in Luxemburg to 30 in Albania. This means that volume of consumption for Luxemburg was 48 per cent above the EU27 average, while Albania’s was 70 per cent below the EU27 average. Due to differences in government expenditures for households across countries, variations observed between countries are to be treated with caution. It is important to look at AIC in the context of the similar government expenditure structures. Among Nordic countries, Norway had the highest relative volume of AIC in 2008, replacing Iceland. Changes in relative AIC volumes from 2007 to 2008 for the rest of the Nordic countries were mixed, from no change for Norway, to a weak relative increase for Finland and lastly weak relative decreases for Denmark and Sweden. The Western Balkan area on the other hand showed strong relative increases in the volume of AIC, and Montenegro is the only Western Balkan country whose volume of AIC index was over 50.
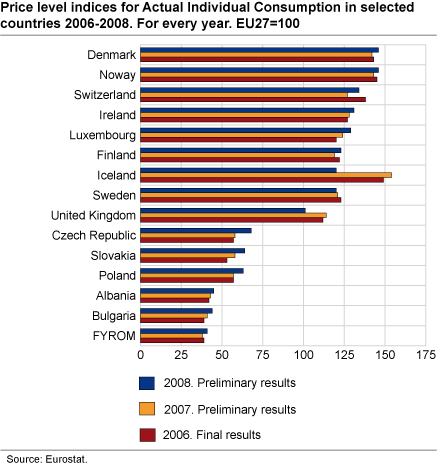
Norwegian price levels remain high
Figures for 2008 show that Norway and Denmark have the highest relative price levels. Switzerland, Ireland and Luxembourg followed Denmark and Norway. Countries with relative low price levels in Europe are the Former Yugoslavia Republic of Macedonia, Bulgaria and Albania. For the rest of Europe, only slight increases in relative price levels were seen from 2006 to 2008. There are two exceptions: Iceland and the United Kingdom, which both had a strong drop in relative price levels in 2008. For Iceland, the strong depreciation of the Icelandic kròna from 2007 to 2008 caused a big drop in the price levels. For the United Kingdom, the exchange rate effect was also seen but it was not as strong as Iceland. The appreciation of the Czech koruna, the Polish zloty and the Slovakian koruna affected the comparative price levels in those countries and led to relative price hikes in these countries.
|
The main results for this survey are published in EUROSTAT’s Statistics in focus . |
|
The 27 EU Member States, the three EU Candidate Countries (Croatia, the former Yugoslavia Republic of Macedonia and Turkey), three EFTA Member States (Iceland, Norway and Switzerland) and the four Western Balkan countries (Albania, Bosnia and Herzegovina, Montenegro, Serbia) all participated in the European Comparison Programme (ECP). Actual Individual Consumption (AIC) consists of goods and services paid for by individuals as well as services paid for by non-profit institutions and by government for the purpose of individual consumption, mostly education and health services. AIC is preferred to household consumption in international comparisons because the amount of individual services provided by government varies across countries. Comparative study government expenditures for Norway, Sweden, Denmark and the United Kingdom showed that the Scandinavian countries used more money for government expenditures compared to the United Kingdom from 1994 to 2006. (Jacobsen, 2009) |
Tables:
- Table 1 Volume indices of GDP per capita. Price level adjusted. 2006-2008. For every year. Price level adjusted. EU27=100
- Table 2 Volume indices of Actual individual consumption per capita, Price level adjusted. 2006-2008. for every year. EU27=100
- Table 3 Price level indices of Actual individual consumption per capita. 2006-2008. For every year. EU27=100
This page has been discontinued, see Comparison of price levels in Europe, Annually.
Additional information
Contact
-
Birte Larsen Sandstå
E-mail: birte.sandsta@ssb.no
tel.: (+47) 92 60 56 03
-
Hamdi A. Mohamed
E-mail: hamdi.mohamed@ssb.no
tel.: (+47) 46 81 54 76
-
Norway-ppp@ssb.no
E-mail: norway-ppp@ssb.no