Content
Published:
This is an archived release.
Norway heads price and income comparison
The five Nordic countries, Ireland and Switzerland stand out with Europe's highest price levels. Among the Nordics, this is especially true for Denmark, Iceland and Norway, and less so in the case of Finland and Sweden. However, all these countries also have a high gross domestic product (GDP) per capita, even when the high price levels are taken into account.
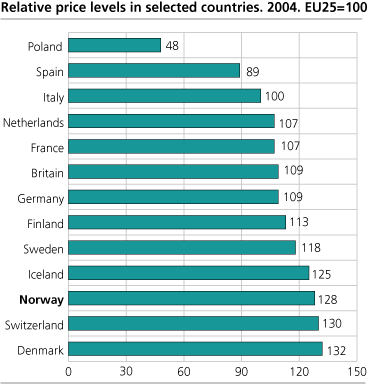
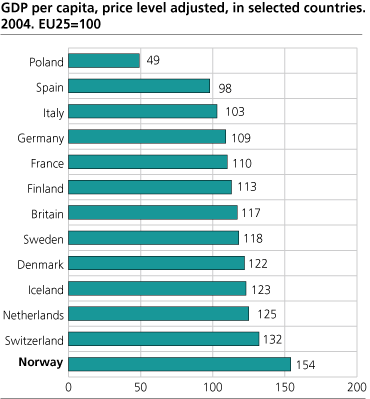
In 2004, Norway's relative price level was 28 per cent higher than the average of the 25 EU member countries (EU25), whereas the country's price level adjusted GDP per capita was 54 per cent higher than the EU average.
These are among the results from the European Purchasing Power Survey 2003 and 2004, recently published by Eurostat. The purpose of this survey, which is carried out in 31 European countries, is to provide an international comparison of relative price levels. These price level indicators are used, in turn, to adjust other economic indicators like for instance GDP per capita for price level differences.
A heterogeneous European picture
Focusing on the 2004 results, the relative price levels of Denmark, Switzerland and Norway are about 30 per cent higher than the EU25 average. Iceland is at about the same level as Norway, whereas Ireland, Sweden and Finland's price levels are somewhat closer to the European average. Among the four biggest EU economies, Italy stands out with a price level somewhat below that of France, Britain and Germany, all of which are very similar in this respect.
Among the EU/EFTA-countries, the lowest price levels are found in Poland, Lithuania, Latvia, Slovakia and the Czech Republic, about 50 per cent below the EU average, or 60 per cent below Norway's level. If we focus on the 15 member states of the "old" EU, there are still remarkable differences among countries: The price levels of Greece and Portugal barely exceed 60 per cent of Denmark's.
Alcohol and tobacco, food, and services contribute to Norway's high price level
If we focus exclusively on goods and services for actual individual consumption, Norway's relative price level is 38 per cent above the EU25 level, at about the same level as Denmark, and 14 per cent above Sweden. In particular alcohol and tobacco, food and services stand out with a high price level in Norway. In the case of the former two, the high Norwegian price level could be seen as a result of deliberate policies, whereas the price level for services to a large extent is determined by the country's high labour costs.
Apparent price level decrease due to exchange rate movements
From 2003 to 2004, Norway's price level appears to decrease relative to the EU. Since the European Purchasing Power Survey is primarily a comparison of countries' relative price levels at a given point in time, one should not attach too much weight to this observation. Still, it seems natural to view the apparent 5 per cent decrease from 2003 to 2004 in light of the development of exchange rates: Between the two years, the Norwegian krone depreciated by 4.6 per cent against the euro, thus "making Norway cheaper" as seen from abroad. A lower inflation rate in Norway than in many other European countries also contributed to this.
For most countries in the survey, there is no major change in the relative price level from 2003 to 2004.
Strong link between price and income levels
If seen in isolation, relative price levels do not tell us anything about the material living conditions in the countries surveyed. However, price level indicators can be used to adjust income measures like for instance a country's GDP per capita for differences in price levels.
Like in previous years, Luxembourg clearly stands out with the highest price level adjusted GDP per capita in Europe. In both 2003 and 2004, the country's income level was more than twice as high as the EU25 average, and about 50 per cent higher than Norway's level. Norway comes out second on the list, 54 per cent above the EU average. This is 26 per cent above Denmark and 30 per cent higher than Sweden.
In addition to Luxembourg and Norway, the list of obvious "high income countries" includes Ireland, Switzerland, the Netherlands, Iceland, Austria and Denmark. In all those countries, price level adjusted GDP per capita exceeds the EU25 average by more than 20 per cent. As we have pointed out above, countries with high price levels in many cases also have high income levels, and it is a striking feature of this kind of analyses that price and income levels tend to go hand in hand. However, this is by no means always so. For instance, the Netherlands and Austria do not appear to have particularly high price levels in our comparison.
The lowest price level adjusted GDP per capita is found in Turkey, Bulgaria and Romania, at less than one third of the EU25 average. Among the EU and EFTA countries, the three Baltic countries, Poland and Slovakia have the lowest level of per capita income as measured by GDP. However, the new EU member countries in Central and Eastern Europe are by no means homogeneous in this respect: Whereas Latvia's GDP per capita stands at 43 per cent of the EU average, the corresponding figure for Slovenia is 79 and for the Czech Republic 71 per cent. The latter two are thus approaching the level of "old" EU members Greece and Portugal.
Tables:
This page has been discontinued, see Comparison of price levels in Europe, Annually.
Additional information
Contact
-
Birte Larsen Sandstå
E-mail: birte.sandsta@ssb.no
tel.: (+47) 92 60 56 03
-
Hamdi A. Mohamed
E-mail: hamdi.mohamed@ssb.no
tel.: (+47) 46 81 54 76
-
Norway-ppp@ssb.no
E-mail: norway-ppp@ssb.no


