Content
Published:
This is an archived release.
High level of GDP despite high price level
Norway remains among the countries with the highest level of GDP per capita, even when differences in relative price levels between countries have been taken into account. The relative price level as such, however, is among the highest in Europe. Despite some fluctuation from one year to the next due to unstable revenues from the petroleum sector, Norway has enjoyed a high level of income in spite of its high price level during the entire 1995-2002 period.
The statistical office of the European Commission, Eurostat, has just released new results of the European Comparison Programme, which surveys the relative price levels of 31 European countries. The results for 2001 are final, whereas the 2002 figures are still subject to adjustment. In addition to the regular results for 2001 and 2002, preliminary, revised results for the years 1995-2000 have been released.
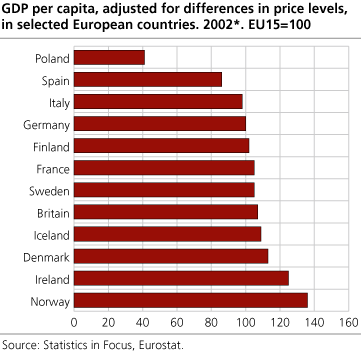
GDP per capita, adjusted for price level differences, 2002: Luxembourg, Norway and Ireland on top
Among the EU and EFTA countries, Luxembourg has been standing out for several years with regard to its very high GDP per capita, which, taking differences in relative price levels into account, is estimated at 89 per cent above the average of the 15 EU member countries seen as a whole. To some extent, this is because of the fact that a considerable proportion of Luxembourg employees are living in the neighbouring countries. They thus contribute to the country's GDP without being included in the resident population.
Apart from Luxembourg, Norway and Ireland stand out with a high level of price level adjusted GDP per capita in 2002: Norway is 36 percent and Ireland 25 percent above the EU average. In the case of Norway, the high income level is, to a considerable extent, due to the revenues from the petroleum sector. The figure for Ireland is remarkable in view of the fact that Ireland used to be among the poorer of the EU countries as late as in the mid-1990s. Economic growth in Ireland has, however, been strong and steady for a long time.
Other countries with a level of GDP per capita clearly above the EU average are Denmark, the Netherlands, Switzerland and Austria. If we look at the current EU members, the pro capita GDP of Greece and Portugal are both 29 per cent below the EU average. Still, among the ten countries expected to join the EU next spring, only Cyprus, Malta and Slovenia is anywhere near the income level of Greece and Portugal. Most of the other acceding countries have considerably lower income levels.
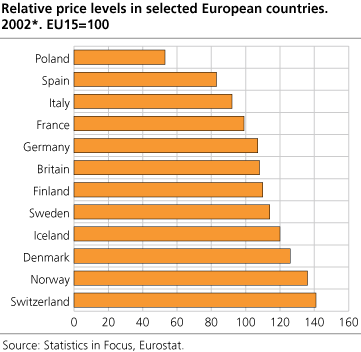
High price levels in the EFTA countries and Denmark
Switzerland, Norway, Denmark and Iceland are the four countries that stand out with the highest relative price level of GDP in 2002. This is broadly in line with the results from previous years. In 2002, the relative price level of Switzerland was 41 per cent above the EU average. The corresponding figure for Norway was 36 per cent, for Denmark 26 per cent, and for Iceland 20 per cent. Sweden also had a relatively high price level.
It is frequently assumed that there is a degree of correlation between countries' relative income levels - as measured by their price level adjusted GDP per capita - and their relative price levels. The 2002 results clearly indicate that this is indeed the case if we look at the broad picture: The EFTA countries and Denmark have high levels of both income and prices, and the poorer among the EU countries also have comparatively low price levels. In several of the new EU member countries, the level of income and prices is less than 50 per cent of the average for the current EU members. If we focus on each single country, however, it is easy to realise that there is no clear-cut relationship between countries' relative level of income and prices.
High degree of stability over time
The surveys carried out within the framework of the European Comparison Programme are primarily designed to investigate price level differences between countries at one particular point in time. However, it is a common attitude that time series based on figures from these surveys, if interpreted with care, may give a realistic picture of the development in relative price levels and price level adjusted GDP. During 2003, Eurostat and the 31 participating countries have carried out a comprehensive revision of all input data back to 1995. The purpose of this exercise has been to improve comparability over time.
If we consider the developments between 1995 and 2002, there is a high degree of stability in the results for a majority of countries. Among the EU and EFTA countries, Norway shows a relatively high degree of fluctuation in its per capita GDP from one year to the next. The reason for this is that the revenues from the petroleum sector are highly unstable, due to oil price and exchange rate fluctuation. Norway's relative price level remains relatively stable up until 2001, but from 2001 to 2002, there is an increase which can be traced back to the strong appreciation of the krone. Ireland, previously on of the poorer EU member countries, shows steady increases in its per capita GDP throughout the entire period. The relative price level in Ireland has also increased.
Most of the new EU members in Eastern Central Europe show a slight increase in their relative price levels, but also in their per capita GDP when adjusted for price level differences. To the extent that this is also the case for household incomes, we can assume that even though the price level has increased as a consequence of increased openness to trade and investment, incomes have increased even faster.
The revision of the input data for the years 1995-2000 has not yet been entirely completed, and changes can be expected as new and improved data is being phased in and methods harmonised over time and between countries. This is particularly the case for the countries of Eastern Central Europe. The final results of the revision can be expected in summer 2004.
Read more in Eurostat 's " Statistics in Focus ".
Tables:
- Table 1 Purchasing power survey 2001. Purchasing power parities, price level indices and volume indices for GDP. Final results
- Table 2 Purchasing power survey 2002. Purchasing power parities, price level indices and volume indices for GDP. Preliminary results
- Table 3 Purchasing power survey. Price leve indices and volume indices for GDP. Preliminary, revised results 1995-2000
This page has been discontinued, see Comparison of price levels in Europe, Annually.
Additional information
Contact
-
Birte Larsen Sandstå
E-mail: birte.sandsta@ssb.no
tel.: (+47) 92 60 56 03
-
Hamdi A. Mohamed
E-mail: hamdi.mohamed@ssb.no
tel.: (+47) 46 81 54 76
-
Norway-ppp@ssb.no
E-mail: norway-ppp@ssb.no