Content
Published:
This is an archived release.
Norway on top in GDP comparison
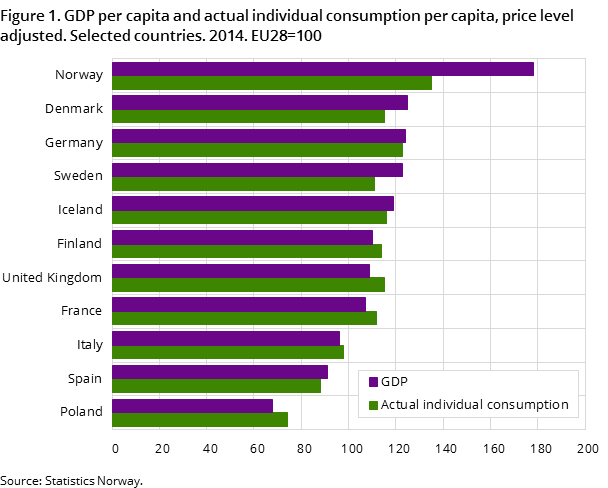
Norway still had one of the highest price level-adjusted Gross Domestic Product (GDP) per capita in Europe in 2014. The level of GDP per capita for Norway in 2014 was closer to the European average compared to 2012 and 2013 due to the export price decrease for crude oil.
| 2014 | |||
|---|---|---|---|
| Gross Domestic Product | Actual individual consumption | Actual individual consumption | |
| Volume indices of real expenditure per capita (EU28=100) | Volume indices of real expenditure per capita (EU28=100) | Price level indices (EU28=100) | |
| 1Source: Eurostat | |||
| Norway | 178 | 135 | 158 |
| Iceland | 119 | 116 | 121 |
| Sweden | 123 | 111 | 136 |
| Denmark | 125 | 115 | 140 |
| Finland | 110 | 114 | 124 |
| France | 107 | 112 | 107 |
| Italy | 96 | 98 | 103 |
| Poland | 68 | 74 | 53 |
| Spain | 91 | 88 | 93 |
| United Kingdom | 109 | 115 | 122 |
| Germany | 124 | 123 | 101 |


In 2014, Norway’s price level-adjusted GDP per capita was 78 per cent above the average of the 28 EU countries (EU28). Only Luxembourg had a higher GDP per capita than Norway. However, Luxembourg’s high GDP per capita is due to the fact that a large share of the country’s employees are living in the neighbouring countries and thus are contributing to GDP without being included in the population. Switzerland has the third highest GDP per capita of 62 per cent above the average of the EU28. Ireland, The Netherlands, Austria, Denmark, Germany and Sweden followed with a GDP per capita from 20 to 35 per cent above the EU28 average.
Cyprus, Finland, Italy and Norway with largest relative decreases from 2012-2014
Changes over time in the ranking of countries in the GDP comparison can be attributed to either changes in the nominal GDPs, changes in the price level indicators (PPPs), changes in the population, or a combination of these factors mentioned. There were minor changes in the ranking of countries from 2012 to 2014, but with some exceptions. Cyprus had the highest relative decrease in GDP per capita. Finland, Italy, Norway and Sweden also had relative decreases in the same period. In 2012, Norway had a GDP per capita 87 per cent above EU28, while the 2014-result was 78 per cent above EU28. The relative GDP decrease for Norway in the period was due to a considerable price decrease for Norway’s most important export article, crude oil, in the last six months of 2014.
Countries in East and central Europe generally have lower levels of GDP per capita compared to western European countries. However there is noticeable positive development in some of these countries. Macedonia, Lithuania, Latvia, Montenegro and Hungary were the countries with the largest relative positive growth in GDP per capita in 2012-2014, and followed by Czech Republic and Bosnia-Hercegovina.
Consumption levels highest in Luxembourg, Norway and Switzerland
In international comparisons, the GDP per capita is used as an estimate of the material prosperity of a country. But the indicator “Actual Individual Consumption” in many cases may provide a more accurate picture of residents’ actual living standards, even if savings also should be considered in this matter.
Luxembourg, Norway and Switzerland head the comparison of Actual Individual Consumption per capita in 2014 - 41, 35 and 31 per cent above the average of the EU28 respectively. Actual individual consumption per capita for Norway is around 15-20 percent higher than the other Nordic countries. Germany and Austria also have high levels of actual individual consumption, 23 and 22 per cent higher than the EU28 average respectively. Balkan countries, with the exception of Greece, come out at the bottom in the comparison. For Albania, Bosnia-Hercegovina, Macedonia and Serbia consumption of goods and services is less than half the average for EU28. The consumption level for Bulgaria, Montenegro, Romania and Croatia is slightly higher, around 40 to 50 percent under EU28. Turkey’s level of consumption is in the latter group.
Norway and Switzerland are Europe’s most expensive countries
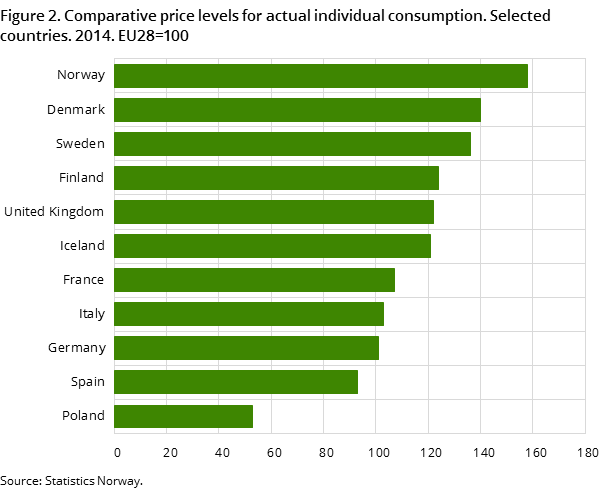
Norway and Switzerland were Europe’s most expensive countries in 2014, with price levels 58 and 56 per cent above the EU28 average, respectively. If we compare Norway’s price level with its neighbours, it is 13 per cent above the level of Denmark and 16 per cent above the level of Sweden. Other countries with relatively high price levels are Luxembourg, Finland and Ireland. The countries with the lowest relative price levels in the survey are situated in South Eastern Europe. In Macedonia, Bulgaria and Albania, the price levels of goods and services for actual individual consumption are around a quarter of the level in Norway. Changes in the relative price levels over time can be attributed to different inflation rates in the countries. But, in many cases, the changes are rather due to changes in the countries exchange rate compared to the Euro.
From EU27 to EU28; Croatia became a member state on 1 July 2013Open and readClose
The level of GDP and actual individual consumption per country is expressed as indices relative to the average of the 28 EU member states (EU28=100), after Croatia became an EU member state on 1 July 2013.
This page has been discontinued, see Comparison of price levels in Europe, Annually.
Additional information
Contact
-
Birte Larsen Sandstå
E-mail: birte.sandsta@ssb.no
tel.: (+47) 92 60 56 03
-
Hamdi A. Mohamed
E-mail: hamdi.mohamed@ssb.no
tel.: (+47) 46 81 54 76
-
Norway-ppp@ssb.no
E-mail: norway-ppp@ssb.no
