Content
Published:
This is an archived release.
Norway tops GDP and price comparisons
Figures recently released by Eurostat show that Norway retained Europe’s second highest price level-adjusted Gross Domestic Product (GDP) per capita in 2012. Only Luxembourg is above Norway in the comparison, but this is partly due to special circumstances in the Grand Duchy. Norway also had the highest price level in the survey.
| 2012 | |||
|---|---|---|---|
| Gross Domestic Product | Actual individual consumption | Actual individual consumption | |
| Volume indices of real expenditure per capita (EU28=100) | Volume indices of real expenditure per capita (EU28=100) | Price level indices (EU28=100) | |
| 1Source: Eurostat | |||
| Norway | 195 | 137 | 168 |
| Iceland | 115 | 114 | 111 |
| Sweden | 126 | 117 | 136 |
| Denmark | 126 | 114 | 145 |
| Finland | 115 | 116 | 123 |
| France | 109 | 114 | 109 |
| Italy | 101 | 100 | 102 |
| Poland | 67 | 73 | 53 |
| Spain | 96 | 92 | 94 |
| United Kingdom | 106 | 114 | 117 |
| Germany | 123 | 123 | 101 |


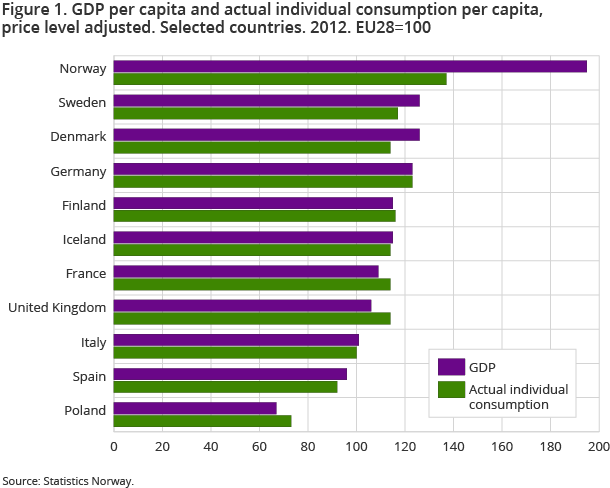
In 2012, Norway’s price level-adjusted GDP per capita was 95 per cent above the average of the 28 EU countries (EU28). Only Luxembourg had a higher GDP per capita than Norway. The extraordinary result for Luxembourg is due to the fact that a large share of the country’s employees live in neighbouring countries and thus contribute to GDP without being included in the population. The next country on the list, the EFTA country Switzerland, had a GDP per capita that was 58 per cent above the average of the EU28. This is followed by Austria, Ireland, the Netherlands, Sweden, Denmark, Germany and Belgium; all with a GDP per capita that is 20-30 per cent above the EU28. The countries in Eastern and Central Europe in general had a lower GDP per capita compared to the Western European countries.
Positive development in eastern Europe
Price level-adjusted GDP per capita for Norway compared to the majority of the countries in the survey have had a positive development during the last few years. In a Europe hit by recession, Norway is standing out as one of few countries with relative growth in the period 2010-2012. It is also worth noticing that with the exception of Norway, it is the countries in Eastern and Central Europe that had the largest relative growth in price level-adjusted GDP per capita between 2010 and 2012. Latvia, Lithuania, Albania, Estonia, Turkey, Bulgaria and Poland stand out among these. Greece is positioned at the opposite end of the ranking. Years of economic recession are now clearly reflected in the statistics. In 2010, Greece had a GDP per capita that was 12 per cent below the EU28 average, while in 2012, the level was 25 per cent below the EU28, and close to the GDP per capita level of Lithuania and Estonia. Portugal and Cyprus also had a significant negative growth compared to other European countries in the period.
Norway also has highest consumption level
While Gross domestic product (GDP) per capita is often used as an estimate of the material prosperity of a country, “actual individual consumption per capita” is an indicator more suited to giving a robust picture of the living standards in various countries. Actual individual consumption measures the amount of goods and services consumed by individuals, regardless of whether it is households or the public sector that is paying for these.
For a country with high savings, like Norway, the difference between the level of GDP per capita and actual individual consumption per capita is quite apparent in the figures. Figure 1 shows the level of both GDP and actual individual consumption per capita. The bars for actual individual consumption show the volumes of goods and services consumed by private households in each country compared to the average consumption in the 28 EU countries. Luxembourg and Norway also head the comparison for actual individual consumption per capita, but here they are only 38 and 37 per cent above the EU28 average respectively. Actual individual consumption in Norway is still almost 20 per cent higher than in Denmark and 18 per cent higher than in Sweden and Finland.
Norway and Switzerland stand out as Europe’s most expensive countries
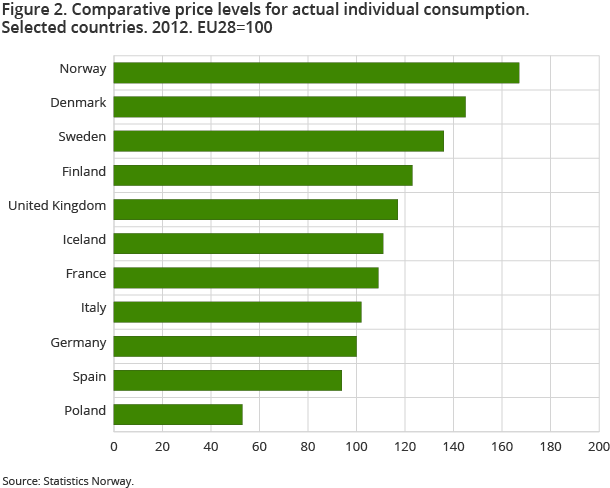
Figure 2 shows the price levels in the European countries relative to the European average. The figure shows the price levels for goods and services for actual individual consumption. Norway and Switzerland, which had the highest GDP per capita in the comparison, also stand out as Europe’s most expensive countries, with price levels of 68 and 66 per cent above the average price level respectively. This is around 15 per cent above the level of Denmark and 23 per cent above the level of Sweden. Other countries with relatively high price levels are Luxembourg, Finland and Ireland. Currency exchange rates are crucial in international price level comparisons. Norway’s price level, for example, has increased relative to the other countries in the period 2010-2012, but this is mainly due to the appreciation of the Norwegian krone against the euro. The countries with the lowest relative price levels in the survey are situated in south eastern Europe. In Macedonia, Bulgaria, Albania and Serbia, the price levels of goods and services for actual individual consumption are below 50 per cent of the average price level of EU28.
Croatia member of EU: EU27 now EU28Open and readClose
The volumes per country are expressed as indices related to the average of the current 28 EU member countries (EU28), after Croatia became a member of the European Union from 1 July 2013.
This page has been discontinued, see Comparison of price levels in Europe, Annually.
Additional information
Contact
-
Birte Larsen Sandstå
E-mail: birte.sandsta@ssb.no
tel.: (+47) 92 60 56 03
-
Hamdi A. Mohamed
E-mail: hamdi.mohamed@ssb.no
tel.: (+47) 46 81 54 76
-
Norway-ppp@ssb.no
E-mail: norway-ppp@ssb.no
