Content
Published:
This is an archived release.
High GDP, strong relative growth over time
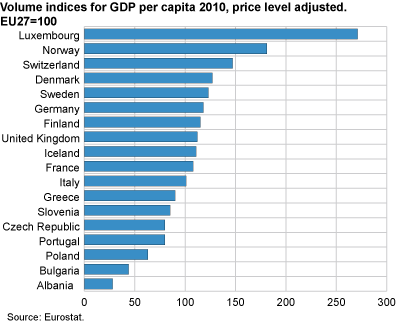
In 2010, Norway maintained its position as the country with the second highest price level adjusted Gross Domestic Product (GDP) per capita in Europe. Only Luxembourg surpassed Norway. Norway’s overall position amongst the European countries improved from 1995-2000.
In 2010, price level adjusted GDP per capita was 81 per cent above the average of the 27 EU member countries (EU27). Luxembourg still heads the list due to the fact that a high proportion of the country's employees live in neighbouring countries and thus contribute to the economy without being included in the population. Other countries with a high price level adjusted GDP per capita were Switzerland, the Netherlands, Ireland, Denmark and Austria. In a Nordic comparison, the Norwegian level was around 45 per cent higher than in Denmark and Sweden, and 57 per cent higher than in Finland.
Large differences between Eastern and Western Europe
Countries in Eastern Europe in general had lower levels of GDP per capita compared to countries in Western Europe. Exceptions were Czech Republic and Slovenia, which have almost the same GDP levels as Portugal and Malta. The bottom of the list includes several countries in South-eastern Europe.
1995-2010: Norway with strong relative growth
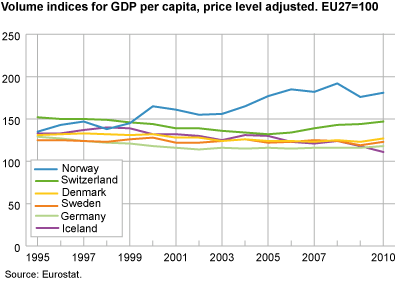
Norway had a substantial relative growth in GDP per capita in the period 1995-2010 seen as a whole. In 1995, Norway was also among the countries with the highest GDP per capita, together with Austria, Iceland, Denmark, Belgium and Germany, while Sweden was close behind. In 1995, only Luxembourg and Switzerland had higher results compared to Norway. In 2010, Norway’s position has improved considerably, with a GDP per capita 20 per cent higher than Switzerland, 40-50 per cent above the levels in Denmark, Sweden, Belgium and Germany, and more than 60 per cent higher than the level of Iceland.
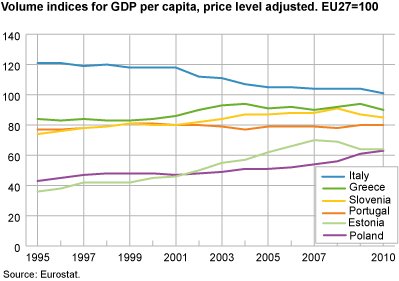
In time series of GDP per capita it is important to note that the results for one country are always relative to the results for all countries. A negative change in indices for a country in the period 1995-2010 from 120 to 110 for example, would not necessarily mean that there has been a negative growth of GDP for the country. The explanation could be that the growth of the country has been smaller than the growth of the other countries in the period.
Improvement for eastern countries
Another significant tendency in the period 1995-2010 was that several eastern European countries had strong relative growth in price level adjusted GDP per capita. The Baltic countries Estonia, Latvia and Lithuania had the strongest growth, despite substantial decreases from 2008 to 2009. Turkey, Slovakia, Poland, Romania and Bulgaria were other examples of countries with strong relative growth. These countries experienced a remarkable improvement in levels of prosperity in the said period. The results could also be seen as an indication of convergence - the traditionally poorer countries in Eastern Europe has approached the prosperity level of the western countries. However, for many of the eastern European countries, GDP per capita is still below half of the EU27 average.
|
The results show GDP per capita, converted by purchasing power parities. This ensures that differences in price levels among countries are taken into account. The volumes per country are expressed as indices related to an average consisting of the 27 EU member countries (EU27). |
Read more in Eurostat’s Statistics in Focus or in Eurostat’s statistical database .
Tables:
This page has been discontinued, see Comparison of price levels in Europe, Annually.
Additional information
Contact
-
Birte Larsen Sandstå
E-mail: birte.sandsta@ssb.no
tel.: (+47) 92 60 56 03
-
Hamdi A. Mohamed
E-mail: hamdi.mohamed@ssb.no
tel.: (+47) 46 81 54 76
-
Norway-ppp@ssb.no
E-mail: norway-ppp@ssb.no


