Content
Published:
This is an archived release.
Norway relatively lower in GDP comparison
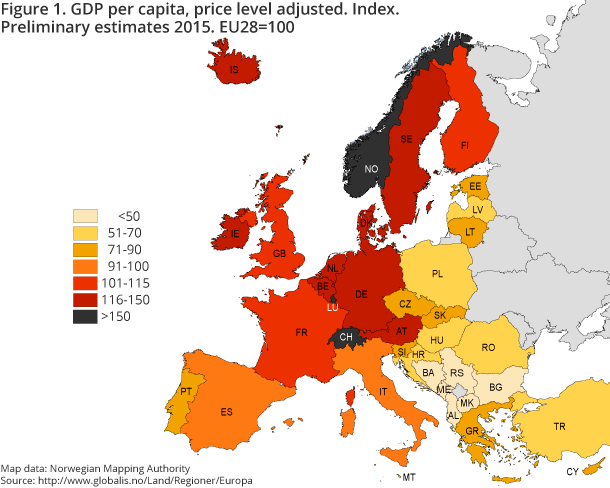
In 2015, Norway continued to have the second highest GDP per capita in Europe. The price fall in petroleum, Norway’s main export product, is an important factor behind Norway’s lower GDP per capita in 2015.
| 2015 | |
|---|---|
| 1Source: Eurostat | |
| Norway | 163 |
| Iceland | 124 |
| Sweden | 123 |
| Denmark | 124 |
| Finland | 108 |
| France | 106 |
| Italy | 95 |
| Poland | 69 |
| Spain | 92 |
| United Kingdom | 110 |
| Germany | 125 |

* = preliminary figures
The GDP per capita price-level adjusted figures for countries in Europe continue to show major disparities. Luxembourg tops the list with a GDP per capita level well above the average of the 28 EU countries.
Luxembourg’s high GDP per capita is due to the high percentage of the country’s workforce living in neighbouring countries who contribute to the GDP but are not included in the resident population.
Lower export price of oil, lower GDP per capita for Norway
Norway’s GDP was 63 per cent above the EU average for 2015, and 79 per cent above the average the year before. Switzerland and Ireland trailed Luxembourg in the comparison, with GDP per capita (price-level adjusted) at 62 and 45 per cent above the average respectively in the 28 EU countries. The lower price for petroleum, our main export product, is an important factor for Norway’s lower GDP per capita in 2015.
High GDP levels in Western Europe
The next cluster of countries is the Netherlands, Austria, Germany, Iceland, Denmark and Sweden, with GDP per capita between 23 and 29 per cent of the EU average. Belgium, United Kingdom, Finland and France followed, with GDP per capita between 6 and 17 per cent above the EU-28 average.
The five non-EU members in West Balkan are bottom of the list; Bosnia-Herzegovina, Albania, Serbia, Macedonia and Montenegro. These countries have GDP per capita around 60-70 per cent below the EU average.
Changes in GDP per capita, price-adjusted levels are caused by many factors
Changes in the ranking of countries in the GDP comparison are the result of changes in the following;
- nominal GDP,
- price levels (PPP),
- changes in the population,
- or a combination of these factors.
For the majority of the European countries, the changes in ranking were minor.
The results are based on the most recent GDP figures for 2015 and the results from the latest PPP survey from the EU’s statistical office, Eurostat. The results from 2015 are updated in December of that year.
EU28Open and readClose
The level of GDP and actual individual consumption per country is expressed as indices relative to the average of the 28 EU member states (EU28=100).
Additional information
Contact
-
Birte Larsen Sandstå
E-mail: birte.sandsta@ssb.no
tel.: (+47) 92 60 56 03
-
Hamdi A. Mohamed
E-mail: hamdi.mohamed@ssb.no
tel.: (+47) 46 81 54 76
-
Norway-ppp@ssb.no
E-mail: norway-ppp@ssb.no
