Content
Published:
This is an archived release.
Oil and gas gave more profit
Public non-financial corporations achieved a profitable account in the 2011 fiscal year. The high profit is mainly attributed to enterprises involved in mining and quarrying. Corporations involved in electricity, gas, steam and air conditioning supply also achieved high profits.
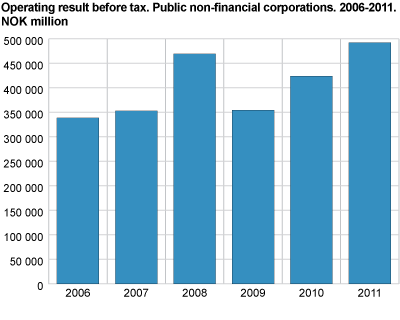
Public non-financial corporations achieved some NOK 492 billion profit before tax in 2011. This is about 36 per cent of the operating income. The corresponding figures for 2010 were NOK 424 billion and 36.2 per cent respectively.
The high profit is mainly attributed to the mining and quarrying, which contributed about NOK 264 billion to the profit before tax, or about 87 per cent. SDFI and Statoil ASA dominate this industry.
The electricity, gas, steam and air conditioning supply had a good year and achieved some NOK 36.3 billion profit before tax and about NOK 22.2 billion net profit for the year.
Information and communication industry achieved a profit before tax some NOK 13 billion and a net profit of just over NOK 11 billion. Transportation and storage realised profit before tax some NOK 6.6 billion and just little less than NOK 2.5 billion net profit. The major corporations in this industry include Telenor ASA, Posten Norge AS and Norges Statsbaner AS.
Central government corporations with highest profit
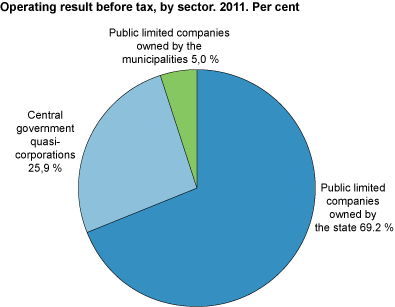
Central government corporations and central government quasi-corporations together accounted for some 95 per cent of the total profit before tax or about NOK 468 billion. SDFI alone accounted for some NOK 134 billion 1 . Other major business units included Statoil ASA, Statkraft SF and Telenor ASA.
For local government, electricity, gas, steam and air conditioning supply enterprises were most profitable. The local government enterprises achieved some NOK 12.9 billion surplus.
Moderate increase in asset value
Public non-financial corporations’ total assets value amounted to some NOK 2 911 billion at the end of 2011. This was an increase of about NOK 144 billion from the previous year. The value of the fixed assets increased by 4.8 per cent, while the value of the current assets relating to sales of goods and services increased by 6.7 per cent.
However, most of the capital is located in a small number of companies. Approximately fifty corporations contributed about three quarters of the total assets. Each of these corporations has an asset value of more than NOK 7 billion. Eleven of these capital-intensive enterprises are owned by local government, and all of these are located in the electricity, gas, steam and air conditioning supply industry.
Stable financial structure
The public non-financial corporations had a relatively stable financial structure in the period 2006 to 2011. The equity ratio was about 42.5 per cent in 2011.
Furthermore, the ratio of fixed assets to long-term capital has been relatively stable and was about 1 during the period. In other words, fixed assets have been financed by long-term capital. The debt-equity ratio has been relatively stable.
The current ratio increased from 0.84 in 2010 to 0.88 in 2011. This means that the current assets are lower than the current liabilities. The figures do not necessarily illustrate the enterprises’ liquidity and therefore require careful consideration.
Central government quasi-corporations have been excluded here because the equity in these corporations cannot be compared with other public corporations.
Public ownershipBoth the central and the local government have a significant ownership interest in Norwegian business and industry. The public companies vary with regard to economic activity. The level of ownership varies from holdings in large listed corporations to small fully-owned enterprises. The corporations are involved in activities such as mining and quarrying, energy supply, transport, real estate operations and rehabilitation. Mining and quarrying is the dominating business area and includes the State’s Direct Finance Investment (SDFI) and Statoil ASA among others. Corporations in the transportation and storage industry are the largest employers. These industries include Posten Norge AS and Norges Statsbaner AS.
DevelopmentAll in all, there were slightly less than 3 300 public non-financial corporations Statistics Norway could obtain accounting data on them for 2011. Furthermore, Statistics Norway could not obtain accounting data for some just little over 100 public corporations. Several reasons could be attributed for the changes. One reason for this development is that some major enterprises have been reorganised either as a result of takeovers or buying and selling of corporations. Another explanation is the improved method of data collection in Statistics Norway for 2009 and 2010. One may notice differences in the figures which were published in the previous year.
The number of the enterprises will differ from the structural business statistics as a result of some business units changing sector to management. The accounting statistics is basically only for the enterprises Statistics Norway could obtain data on them.
Also, some Central government and local government business units are also reclassified to management. As this continues from one year to another, many public corporations may reclassify and as a result no longer be included in the statistics for the public non-financial corporations. About the statisticsThe statistics include all market non-financial corporations in which either the central government or municipalities/county municipalities directly or indirectly own more than 50 per cent of the shares. These include all companies incorporated by special legislation as well as central government market entities. Types of corporationsCentral and local governments are mainly engaged in the following types of corporations: - Private limited companies and public limited companies, including public corporations. - Central and local government market entities, so-called quasi-corporations. - Companies incorporated by special legislation. |
1 The accounting figures are collected from Petoros AS Annual Accounting Report for 2011.
Tables:
- Table 1 Public non-financial corporations. Income statement. Selected accounting figures. NOK million and per cent. 2006-2011
- Table 2 Public non-financial corporations. Balance sheet. Selected accounting figures. NOK million and per cent. 2006-2011
- Table 3 Public non-financial corporations. Income statement and balance sheet by section. Selected accounting figures. NOK million. 2011*
- Table 4 Public non-financial corporations, with out central government enterprises. Selected key figures. 2006-2011
- Table 5 Central government corporations. Income statement. Selected accounting figures. NOK million and per cent. 2006-2011
- Table 6 Central government corporations. Balance sheet. Selected accounting figures. NOK million and per cent. 2006-2011
- Table 7 Central government corporations. Selected key figures. 2006-2011
- Table 8 Central government quasi- corporations. Income statement. Selected accounting figures. NOK million and per cent. 2006-2011
- Table 9 Central government quasi- corporations. Income statement. Selected accounting figures. NOK million and per cent. 2006-2011
- Table 10 Local government owned enterprises. Income statement. Selected accounting figures. NOK million and per cent. 2006-2011
- Table 11 Local government owned enterprises. Balance sheet. Selected accounting figures. NOK million and per cent. 2006-2011
- Table 12 Local government owned enterprises. Selected key figures. 2006-2011
Planned changes in the national accounts statisticsOpen and readClose
New revised figures for national accounts and related statistics will be published in November and December 2014. Statistics Norway complies with international guidelines in its preparation of national accounts and statistics on foreign affairs. New international guidelines have now been issued for these statistics. Statistics Norway is currently in the process of implementing the changes, in addition to new source data for some of the statistics.
Contact
-
Francis Kwamena Acquah
E-mail: francis.kwamena.acquah@ssb.no
tel.: (+47) 40 90 26 62