Content
Published:
This is an archived release.
Improved results for the joint parish council
Gross operating revenues amounted to about NOK 4.4 billion in 2013 compared to about NOK 4.2 billion in 2012. This corresponds to an increase of about NOK 291 million. Operating expenses were NOK 4.2 billion in 2013 compared to about NOK 4 billion in 2012. Gross operating profit for joint parish councils was about NOK 265 million in 2013.
| NOK million | Per cent change | ||
|---|---|---|---|
| 2013 | 2012 | 2012 - 2013 | |
| Transfers from municipalities | 2 588 | 2 484 | 4.2 |
| Transfers from central government | 285 | 267 | 6.7 |
| Payroll expenses | 2 521 | 2 471 | 2.0 |
| Goods and services | 1 132 | 922 | 22.8 |
| Gross operating profit | 265 | 173 | 53.2 |
| Net operating profit | 236 | 152 | 55.3 |
| Investment expenditure | 827 | 578 | 43.1 |

Local authority grants allocated to joint parish councils have gradually increased in recent years, to a total of almost NOK 2.6 billion in 2013. This is an increase of 4.2 per cent, or about NOK 104 million, from 2012 to 2013.
NOK 87 million received as other transfers and contributions
Other transfers and contributions constituted NOK 87 million in 2013, compared to NOK 70 million in 2012. This corresponds to an increase of NOK 17 million.
Municipal grants and transfers represent the most important revenue for the joint parish councils. In 2013, the municipalities transferred more than NOK 2.6 billion to joint parish councils compared to NOK 2.5 billion in 2012. The municipal grants and transfers constituted 61 per cent of the total gross revenues.
Transfers from the central government increased from the previous year. In 2013, the transfers amounted to NOK 285 million compared to NOK 267 million in 2012.
Revenues from transfers and grants from others that also comprise VAT refunds increased by NOK 32 million from 2012 to 2013 and made up about 20.1 per cent of the total gross revenues in 2013. Revenues from user payments, fees and rental payments increased by NOK 116 million from 2012 to 2013 and constituted 10.1 per cent of the total gross revenues.
Maintenance of churches and payrolls goes up
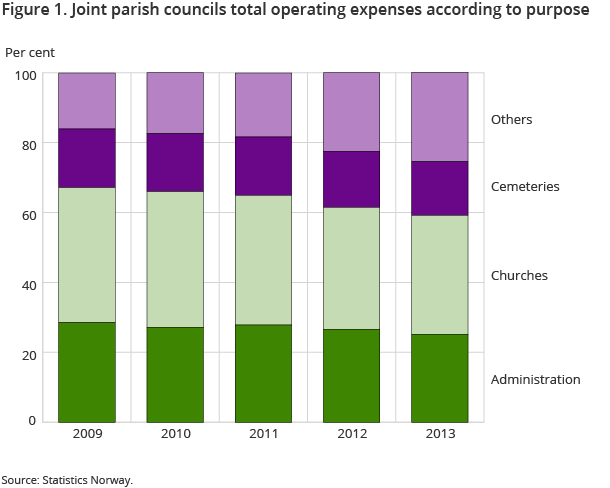
In 2013, the gross expenses for churches were about NOK 1.4 million; an increase of around NOK 31 million from 2012. Most of the church expenses are used to cover payroll expenses, build new churches and maintenance.
Payroll expenses for the joint parishes have increased steadily in recent years. The payroll expenses in 2013 amounted to NOK 2.5 billion; an increase of about NOK 50 million from the previous year. The payroll expenses constituted 60 per cent of the total operating expenses.
Increase in investment expenses
In 2013, investments in buildings and equipment amounted to NOK 827 million; an increase of about NOK 249 million from the previous year. Investment expenses to the churches amounted to NOK 447million or 54 per cent of the total investment expenses. About 64 per cent of the total investment expenses were financed by transfers and contributions. Acquisition of new loans increased from NOK 144 million in 2012 to NOK 296 million in 2013.
Almost NOK 1 billion in long-term liabilities
In 2013, long-term liabilities amounted to NOK 997 million compared to NOK 792 million in 2012; an increase of about NOK 205 million. Current liabilities increased by NOK 66 million in the same period. The joint parish council administered equities of almost NOK 11 billion in 2013; an increase of around 8.7 per cent from the previous year.
20 joint parish councils did not submit their accountsOpen and readClose
A total of 20 out of 417 joint parish councils did not submit their accounts in 2013. The variables for the income statement represent estimated figures for the missing joint parish councils. The estimations have been calculated based on the population statistics.
Variables for the investments and balance sheet are based on reported figures.
The figures for the previous years have been updated.
The figures for total investments only include figures for fixed tangible assets.
Contact
-
Corretta Aluoch Arodi
E-mail: cos@ssb.no
tel.: (+47) 40 90 26 56
-
Anne Brit Thorud
E-mail: anne.brit.thorud@ssb.no
tel.: (+47) 40 90 26 59
