Content
Published:
This is an archived release.
Satisfactory gross operating surplus [Corrected 25 July 2011]
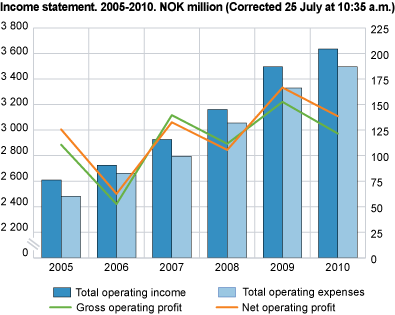
Gross operating surplus for the joint parish councils was NOK 139 million in 2010, a decrease of about NOK 28 million, or 17 per cent, from 2009.
Corrected 25 July 2011 at 12:35 p.m.Errors were detected in the article, two of the tables and two of the diagrams. They have been corrected and the material was republished with new figures 25 July 2011. New figures have also been published in StatBank. |
The joint parish councils’ operating accounts had satisfactory results in 2010. The gross operating surplus was about 3.8 per cent of operating revenues. The total operating revenues increased by 3.9 per cent, whereas the total operating expenses increased by 4.9 per cent.
Lower net operating surplus
Operating revenues increased by NOK 138 million from 2009, to NOK 3 634 million in 2010. Subsidiaries from the local municipalities accounted for 60 per cent of the total operating revenues. Income from transfers and refunds made up more than19 per cent, while revenues originating from sales, fees, rents and other operating revenues accounted for 8 per cent. The distribution of income has not changed significantly since 2005.
Operating expenses increased by NOK 166 million, and amounted to NOK 3 495 million in 2010. Payroll expenses is the single most important item of the expenses and constituted 62 per cent of the operating expenses. Payroll expenses and expenses for goods and services accounted for 88 per cent of the operating expenses.
Net operating surplus was NOK 122 million in 2010, a decrease of NOK 31 million compared to 2009.
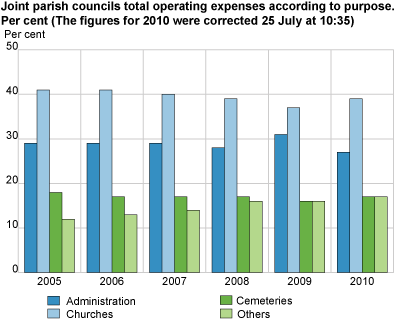
The operating expenses for joint parish councils were as follows; church maintenance accounted for 39 per cent of the total operating expenses, cemeteries 17 per cent and church administration 27 per cent. The remaining 17 per cent was related to other activities connected to the churches.
Increase in investments
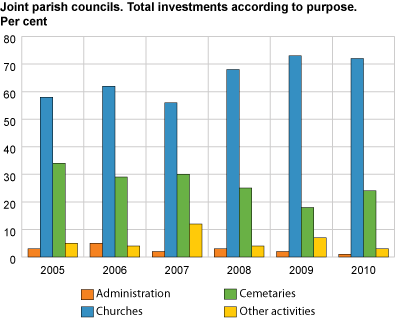
Investments in tangible fixed assets amounted to NOK 685 million in 2010; NOK 40 million more than in 2009. Almost 78 per cent of the total investments were financed by funds, grants and financial contributions, while new loans amounted to 22 per cent or NOK 152 million.
In total, 72 per cent of the investments were related to churches and 24 per cent to cemeteries.
Balance sheet
Total assets administered by the joint parish councils in 2010 amounted to NOK 8.4 billion. This was an increase of about 10 per cent compared to 2009. The increase in total assets since 2005 has been NOK 3.3 million.
Long-term liabilities in 2010 represented 6.3 per cent of total assets. This corresponds to an increase of NOK 98 million compared to 2009.
The net finance has not changed in 2010 compared to 2009. In 2010 the net finance had a negative result of NOK 17 million compared to a negative result of NOK 14 million in 2009. Shares and income from interest were about NOK 25 million in 2010, compared to NOK 26 million in 2009.
The table basisA total of 18 joint parish councils did not submit their accounts for 2010. In the tables presented, data for these councils have been calculated based upon population statistics. The figures for total investments from 2005 to 2010 only include figures for fixed tangible assets. |
Tables:
Contact
-
Corretta Aluoch Arodi
E-mail: cos@ssb.no
tel.: (+47) 40 90 26 56
-
Anne Brit Thorud
E-mail: anne.brit.thorud@ssb.no
tel.: (+47) 40 90 26 59


