Content
Published:
This is an archived release.
Emission intensity on the decline
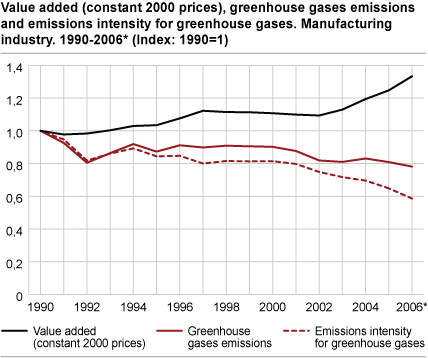
The greenhouse gas emissions from the manufacturing industry decreased from 2002 to 2006 despite a considerable increase in value added. In the same period the service sector has experienced strong economic growth. All in all, the total greenhouse gas emission intensity for Norway has decreased since 1990.
Data from the environmental accounts are used to analyse the interaction between economic growth and impacts on the environment by combining national accounts data and emission statistics for individual industries.
The environmental accounts cover greenhouse gas (GHG) emissions, acidification precursors, ozone precursors, heavy metals and particulates. This article only covers greenhouse gas emissions.
Economy grows faster than emissions
Since 1990, economic growth in Norway has been higher than the growth in GHG emissions, i.e. Norway has become less emission intensive. This trend has been strongest after 1996. The emission intensity (tonnes CO2 equivalent emissions per NOK million value added in constant prices) decreased by 34 per cent between 1990 and 2006.
The decline in emission intensity is mainly due to strong economic growth in less emission intensive industries and the fact that these industries contribute more to the growth in value added. Furthermore, improved utilisation of fossil fuels and the introduction of different environmental measures have also had an effect.
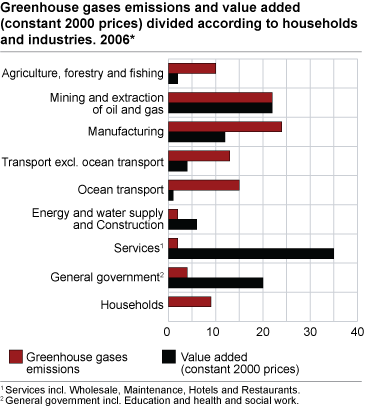
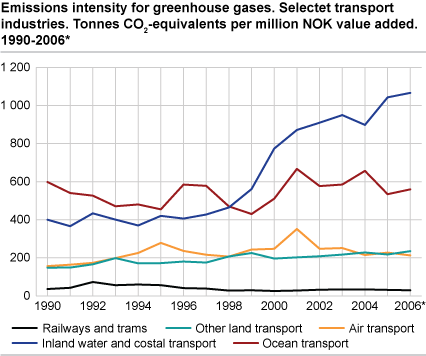
However, the picture is very complex, and statistics at industry level show that economic growth is lower than the growth in emissions in several industries. Transport, manufacturing industries and agriculture, forestry and fishing have the highest GHG emission intensity. While the transport industry (excluding ocean transport) became more emission intensive from 1990 to 2006, the opposite was the case for manufacturing industries and agriculture, forestry and fishing. Although oil and gas extraction is not among the industries with the highest emission intensity, this industry accounted for a large proportion of total emissions due to high activity.
Although the emission intensity has decreased, the GHG emissions have increased by 81 per cent since 1990. In the early 1990s, there was a decrease in emissions, but between 1992 and 1996 the emissions were more or less in parallel to the economic growth. Since 1997, the economic growth has been stronger than the growth in GHG emissions.
The 2006 data show that the trend with lower emission intensity continues. The emission intensity decreased by 3 per cent from 2005 to 2006, and in 2006 the emission intensity was at its lowest level since 1990; 38 tonnes of CO2 equivalents per NOK million value added. As in 2005, there was a slight decline in total GHG emissions in 2006. The 0.6 per cent decrease in total emissions from 2005 to 2006 was mainly due to lower activity in both the process industries and in oil and gas extraction. From 2005 to 2006, the economic growth was 2.2 per cent. Most industries experienced economic growth in this period.
Uncertainty in the emission calculations for ocean transport
Ocean transport is among the industries with the highest emission intensities. Calculations show that in 2006 ocean transport contributed to 15 per cent of total GHG emissions, but only 1 per cent of total value added. The emission calculations for ocean transport are uncertain and show large fluctuations from year to year.
Manufacturing industry is less emission intensive
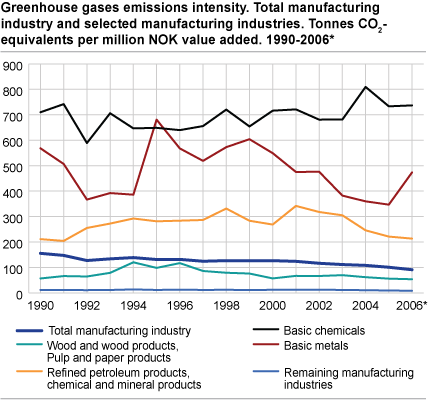
The emission intensity in the manufacturing industry was fairly constant between 1994 and 2001. Since 2000, the emissions have been on the decline while at the same time the manufacturing industries have experienced strong economic growth.
The overall picture for the manufacturing industry is complex. Even if low emission intensive manufacturing industries have contributed strongly to the economic growth in Norwegian manufacturing, emissions from highly emission intensive manufacturing industries have decreased. But the closedown of several enterprises in manufacturing industries that used to have large emissions has also contributed to lower emissions. The total GHG emissions from the manufacturing industries are heavily dependent on the developments in the production of basic chemicals, basic metals and refined petroleum products, chemical and mineral products. Except for the production of basic chemicals, these industries have all become less emission intensive, even though there are large annual fluctuations between the individual industries.
Slight increase in emissions intensity in the extraction industry
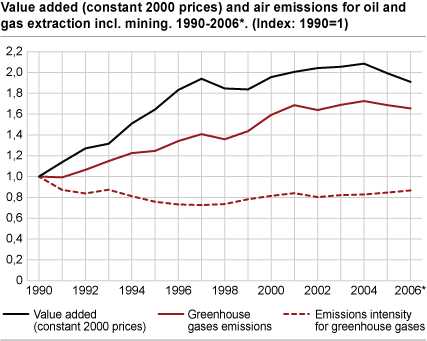
The oil, gas and mining industry accounts for a large share of total GHG emissions, but the emission intensity for this industry is on level with the national average.
In spite of improved energy efficiency, reduced flaring and the introduction of the CO2 tax in 1991, the energy use has increased due to increased activity level. The emissions have increased by 72 per cent since 1990. However, the economic growth has been 87 per cent. The extraction industry was responsible for more than a fifth of the total value added in Norway in 2006.
While the oil, gas and mining industry became less emission intensive in the years up to 1997, the calculations show that the development during the past ten years has moved in the opposite direction. In 2006, the emission intensity was at the same level as in 1993. In 2006, for the third year running, the decline in value added was stronger than the decline in emissions.
Transport more emissions intensive
When excluding ocean transport, other land transport (scheduled motor bus transport, taxi operation and land transport, n.e.c.) in particular has driven the development of total GHG emissions in the transport industry. In 2006, other land transport accounted for 57 per cent of total greenhouse gas emissions and 34 per cent of total value added in the transport industry. The emission intensity has increased steadily in the period 1990-2006. Despite increased fuel efficiency, value added has increased by 50 per cent, while the GHG emissions have increased by 137 per cent. This may be a result of several factors. The volume of products that is transported has increased, so has the transport distance. Increased activity in other land transport must also be seen in connection with the overall growth in the economy.
About the calculationsThe NAMEA accounts (National Accounts Matrix including Environmental Accounts) are integrated environmental accounts with the purpose of comparing economic and environment related data by combining national accounts data and emission statistics at industry level. The ratio between specific emissions from an industry and its value added is called emission intensity (measured as tonnes of CO2 equivalents per NOK value added in fixed prices (production less intermediate consumption)). The NAMEA data are distributed by industry to enable comparisons of economic activity and environmental impacts. NAMEA data use an economic definition of Norway, which is the same as the one used in the national accounts. Ocean transport and international air transport are therefore included. There are important differences between the Norwegian NAMEA emissions data and the official national data on air emissions that are reported to the Kyoto and the Gothenburg protocols and published by Statistics Norway and the Norwegian Pollution Control Authority (SFT). The official national air emissions data set does not include emissions from ocean transport and international air transport, while these industries are included in NAMEA. |
Additional data from the Norwegian Environmental Accounts are available in StatBank Norway .
1Total GHG-emissions excl. Ocean transport
Tables:
Additional information
Contact
-
Ingrid Semb Weyer
E-mail: ingrid.semb.weyer@ssb.no
tel.: (+47) 40 90 23 51
-
Trine Heill Braathu Randen
E-mail: trine.heill.braathu.randen@ssb.no
tel.: (+47) 91 10 67 45


