Content
Published:
This is an archived release.
Stronger growth in emissions than value of production
From 1990 to 2010, the greenhouse gas emissions from Norwegian industries have increased by less than the output from Norwegian industries. The emission intensity has decreased in this 20-year time period. However, the greenhouse gas emissions increased by more than production from 2009 to 2010, and the emission intensity has therefore increased for the first time in 10 years.
Since 1990, the greenhouse gas emission intensities for the economic activity in Norway have gradually declined. This is mainly due to a higher portion of the economic growth coming from activities in less emission-intensive industries, but also better utilisation of fossil fuels and implementation of various mitigation measures, especially in the manufacturing industries.
![Total greenhouse gas emissions (CO2-equivalents], output (constant 2005-prices] and emission intensity for Norwegian economic activity (excl. households). 1990 -2010*. Index, 1990 = 1](/a/en/static/nrmiljo_en/fig-2012-02-13-01-en.gif)
Emission intensities
From a sustainability perspective, the aim is to maintain economic growth in such a manner that the environmental impacts do not increase with the same or higher ratio as the economic growth.
A commonly used variable for production is the value of the national accounts’ variable “output”, which in fixed prices represents a volume measure. |
From 2009 to 2010, the production (in fixed prices) grew by only 1 per cent. The greenhouse gas emissions from Norwegian industries grew by 2.2 per cent, reaching a level of 60.3 million tonnes of CO2-equivalents. This figure includes emissions from ocean transport and international air transport.
In 2010, for the first time in 10 years, the greenhouse gas intensity did not decrease from one year to another. A total of 17.2 tonnes of CO2-equivalents per million NOK produced were emitted; an increase from 2009 of 1.3 per cent. However, the picture is very complex, and the different industries' contributions to changes in output and air emissions vary considerably.
Although at a national level there is an apparent weak connection between economic growth and greenhouse gas emissions, examining trends at the industry level shows that increased activity in several important industries has resulted in increased greenhouse gas emissions that exceed the growth in production (measured in fixed prices).
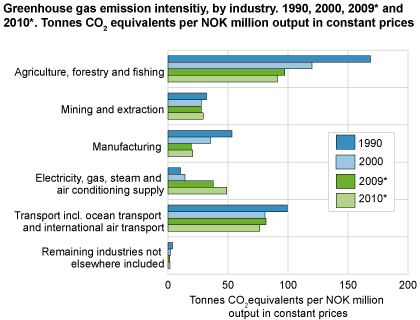
There has been a strong increase in the greenhouse gas emissions’ intensity for the electricity, gas and steam supply. This is due to higher activity at the gas-fired power plant at Kårstø from 2009, and the commissioning of the combined heat and power plant at Mongstad in 2010.
The level of the emission intensities is the highest in the primary industries and the transport industries. The declining trend for the emission intensities in the primary industries is mainly due to structural changes. The activity in the Norwegian aquaculture industry has increased significantly from 1990 to 2010. The aquaculture production, which generates very little of the total greenhouse gas emissions, made up 8 per of total output in the primary industries in 1990. This share increased to 30 per cent in 2010. At the same time, the emission intensities in agriculture also decreased.
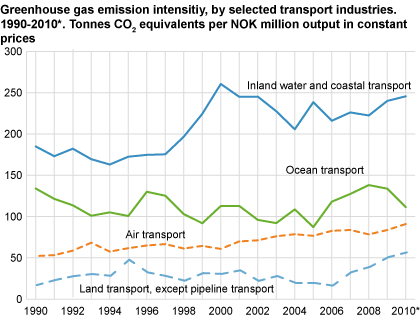
For the transport industries the picture is complex. The main reason for the decline in emission intensities is the increase in the output from the support activities for transportation. These activities emit lower levels of greenhouse gases. Other transport industries, such as land transport (except transport via pipelines), inland and coastal water and air transport, all had higher levels of greenhouse gas emissions per million NOK in 2010 than in 1990.
Calculations show that ocean transport alone contributed 23 per cent of total greenhouse gas emissions in 2010. The emissions data for ocean transport have a high level of uncertainty and vary greatly from year to year. This explains the rather large variations in the emission intensity in the ocean transport.
After many years of decline: increasing emission intensities in the manufacturing industries
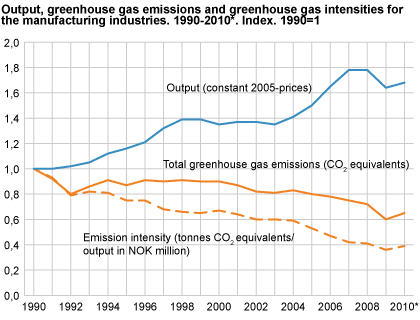
Both greenhouse gas emissions and production (measured in fixed prices) in the manufacturing industries increased in 2010. The greenhouse gas emissions generally increased more, resulting in an increase in the overall greenhouse gas emission intensity for the manufacturing industries of 6 per cent. This increase is mainly due to the increased production level in the emission-intensive paper and paper products industry and the production of basic metals.
The total greenhouse gas emission from the manufacturing industries is strongly influenced by the development in the production of basic metals, the production of refined petroleum products, chemicals and chemical products, and the production of other non-metal mineral products. In 2010, it is the higher activity level in these industries that raises the total greenhouse gas emission from the manufacturing industries and, with the exception of the production of metals, the increase in emissions is at the same levels as the increase in output.
Continued slow increase in emission intensity in oil and gas extraction industry
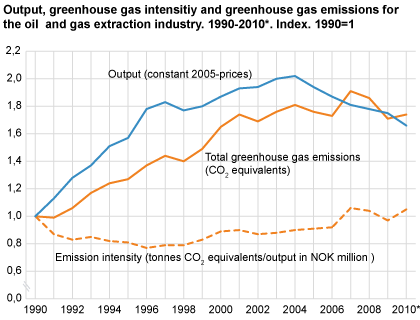
In 2010, the greenhouse gas emission intensity in the oil and gas extraction industry continued to increase after a one year decline in 2009. Due to a strong decrease in the value of the oil production in 2010, the total value of output decreased by 5.6 per cent in 2010. The production of gas increased in 2010. Although there was a decrease in total production of oil and gas, the greenhouse gas emissions increased by 1.7 per cent from 2009 to 2010, causing an increase in the greenhouse gas emission intensities in the extraction industry of 7.7 per cent. These reached a level of 33.3 tonnes of CO2-equivalents per million NOK output. The increased emission intensity from 2009 to 2010 can be explained by higher onshore activities as well as a shift towards a higher portion of the extraction stemming from gas extraction.
Revisions in national accounts figures and new standard industry classificationSince the last emission intensities were published for the years 1990-2010, the statistics used in the calculations have been revised and a revised standard classification for the industry breakdown has been introduced. The current calculation of emission intensities uses the revised national accounts figures published in 2011. Compared to previous publications of emission intensities, using revised national accounts figures has resulted in very modest changes in the growth rates of the emission intensities. The largest revisions due to previous calculations are seen for the years 2008 and 2009. This is because the national accounts data for 2008 and 2009 are now regarded as final, while the 2010 data are still preliminary. The main reason for the changes in absolute values of the emission intensities is that the constant prices are given in constant 2005 prices and not in constant 2000 prices as was the comparison year in previous calculations of the emission intensities The main reason for the revision of the national accounts figures was an adaption to the new industrial classification SIC2007, based on the EU’s new classification NACE rev 2. In addition, new data and results from new estimates for some areas have been included in the year 2002 and onwards. The revisions in GDP and output growth rates are, however, quite moderate. |
StatBank has now been updated with emission intensities for 24 different pollutants calculated both as emissions per output and emissions per value added.
Tables:
Additional information
Contact
-
Ingrid Semb Weyer
E-mail: ingrid.semb.weyer@ssb.no
tel.: (+47) 40 90 23 51
-
Trine Heill Braathu Randen
E-mail: trine.heill.braathu.randen@ssb.no
tel.: (+47) 91 10 67 45