Content
Published:
This is an archived release.
Higher reductions in emissions than in production
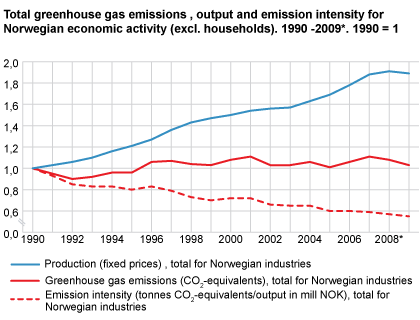
Since 1990 the greenhouse gas emission intensity for the economic activity in Norway has gradually declined. In 2009, both the greenhouse gas emissions and the output from Norwegian industries were reduced. The greenhouse gas emissions were generally reduced the most, but there are differences between the industries.
New calculations of emission to air from Norwegian economic activity juxtaposed with value added and output (in constant prices) confirm that the economic growth has been higher than the increase in greenhouse gas emissions for the period 1990-2011. This is mainly due to a higher portion of the economic growth stemming from activities in less emission-intensive industries, but also better utilisation of fossil fuels and implementation of various mitigation measures, especially in the manufacturing industries.
Since the preliminary emission intensities for 2009 were published in May 2010, there have been new and more detailed calculations of emissions to air from Norwegian economic activities. The emission intensities are more relevant as they are now published three months earlier than previously.
The StatBank is now updated with emission intensities and emissions to air. The National Account figures are still preliminary figures for 2008 and 2009 and therefore not available by detailed industry level.
Emissions intensityFrom a sustainability perspective, the aim is to change the content of the economic growth so that the environmental pressures do not increase at the same rate as, or preferably separate from, the development of GDP. By calculating emissions intensity as emission per produced amount of a good or service over time, we have the possibility to show whether Norway as a whole or the different industries have become more or less emission-intensive over time. The emission intensity falls if the economic activity grows more than the emissions. A commonly used variable for production is the National Account variable “output”, which in fixed prices represents a volume measure. |
Continued decrease in emission intensities
The GHG emissions from Norwegian economic activity (excl. households) amounted to 59.8 million tonnes of CO2-equivalents (see box about Emissions to air from economic activity) . This reduction by 4.6 per cent from 2008 to 2009 was the highest decrease since 1996.
The production trend from 2008 to 2009 for Norwegian companies was strongly influenced by the financial crisis. Most of the industries experienced a reduction in the demand for goods and services. For the first time in more than 40 years, the production measured in constant prices decreased on an annual basis (-1.3 per cent) (see national accounts ). The decrease in production was particularly evident in the emission-intensive industries producing goods. There was a more moderate decrease in the less emission-intensive service industries.
In 2009, the GHG emissions compared to total production (in constant prices) for Norwegian companies in total fell by 3.2 per cent and amount to 19.6 tonnes of CO2-equivalents per million kroner produced. The development in 2009 is largely due to a reduction in the emission intensity in the oil and gas extraction industry.
Strong decrease in the emission intensity in oil and gas extraction
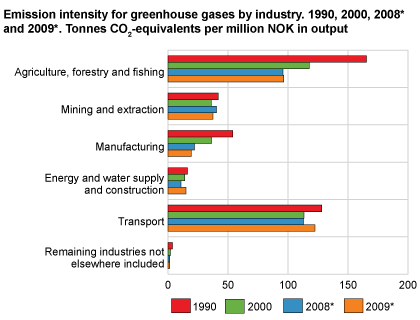
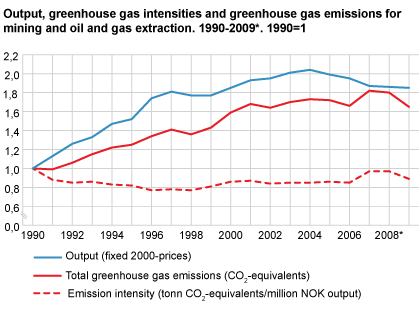
Although a large share of the Norwegian GHG emissions stem from oil and gas extraction (23 per cent), this industry is not among the most emission intensive since the value of its production is high. The reduced emission intensity from 2008 to 2009 of 6.3 per cent is mainly due to reduced GHG emissions. The GHG emissions in 2008 were particularly high due to start-up problems at a new gas terminal. The production in mining and oil and gas extraction was reduced by 3 per cent in the same period.
Lower GHG emissions per produced unit in Norwegian industry
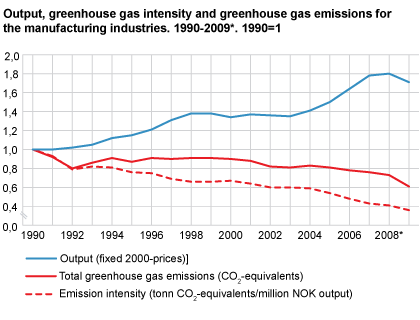
The trend with lower GHG emissions per produced unit (measured in constant prices) continued in the Norwegian industry in 2009. The industry’s production fell by 5 per cent in 2009 while the GHG emissions were reduced by 20 per cent. The decrease in emission intensity in 2009 was primarily due to reduced emissions of nitrogen dioxide (N2O) in the production of chemical raw materials and lower GHG emissions from the metal industry.
but difficult to interpret the development for the transport industries
The transport industry is composed of industries that are very different with regard to GHG emissions and production level. The various transport industries - railway, road (goods and passenger traffic), sea, air and pipeline have all had a very different development.
The aggregate GHG emissions from the transport industries have increased by 16 per cent since 1990. In 2009, the emissions were 22.2 million tonnes of CO2-equivalents, a reduction of 1.3 million tonnes (6 per cent) from 2008. Over 80 per cent of the GHG emissions from the transport industries in 2009 stemmed from ocean transport (60 per cent) and land transport (22 per cent).
The production in the transport industries was 20 per cent higher in 2009 than in 1990. Between 2008 and 2009, the production in all transport industries except pipeline transport fell. The total decrease was 10 per cent.
With the exception of ocean transport and inland and coastal transport, the GHG emissions relative to the value of total production (million in constant prices) have shown a slight increase from 1990 to 2009. However, there are large inter-annual variations. The explanation for the development of emission intensities for the transport industries is very complex. Some of the important underlying factors are structural changes in the transport industries, such as changes in the demand for transport services, the extent of the utilisation of seats and goods capacities and technological changes.
Reduced emission intensity for fisheries, increased for forestry
The production in the primary industries was 15 per cent higher in 2009 compared to 2000, but the GHG emissions have been reduced by 3.7 per cent in the same period. This results in a decrease in the emission intensity of 22 per cent and in 2009 the emissions were 96 tonnes of CO2-equivalents per million kroner production value.
It is especially the development in fishing that has contributed to the decrease in the emission intensity in the primary industries. The production within fishing (in constant prices) has increased by 22 per cent in the last 10 years, while the GHG emissions have remained more or less unchanged. The emission intensity in 2009 was 109 tonnes of CO2-equivalents per million kroner production value. The agricultural industry contributed to 76 per cent of the total emissions from the primary industries in 2009. The emission intensity of this industry has also been reduced in recent years and was 200 tonnes of CO2-equivalents per million kroner production value in 2009. This is a reduction of 7 per cent since 2000.
Emissions to air from Norwegian economic activityIn order to compare emissions to air from Norwegian economic activities, the emissions to air are calculated according to the residence principle, i.e. an economic definition of Norway corresponding to the definitions used in the National Account. This therefore deviates from the Norwegian figures for emissions to air that are reported as part of the Kyoto agreement and calculated using a territorial definition of Norway. In 2009, the GHG emissions from Norwegian economic activity were higher than from Norwegian territory ( see comparable table ). |
Tables:
- Table 1 Output in constant 2000 prices, employment, greenhouse gases, acidifying gases and ozon precurors and intensities. 2009 [Corrected 17 February 2011 at 1035]
- Table 2 Output in constant 2000-basic prices, employment, greenhouse gases, acidifying gases and ozon precurors and intensities [Corrected 17 February 2011 at 1035]
Additional information
Contact
-
Ingrid Semb Weyer
E-mail: ingrid.semb.weyer@ssb.no
tel.: (+47) 40 90 23 51
-
Trine Heill Braathu Randen
E-mail: trine.heill.braathu.randen@ssb.no
tel.: (+47) 91 10 67 45


