Content
Published:
This is an archived release.
Shore zone dispensations still rising
The number of applications for exemptions for new buildings in the shore zone has increased, as has the number of dispensations granted. We are nearly at the 2005 level.
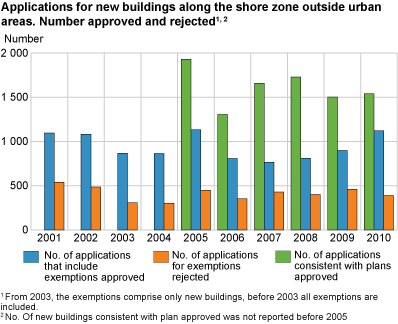
The total number of dispensations granted in the shore zone was 1 122 1 , compared with 900 in 2009. The share of applications granted that include exemptions climbed from 67 to 74 per cent.
The general ban on building developments in the shore zone does not apply in urban areas or areas regulated for development. In 2010, approximately 1 540 applications for new buildings in the coastal zone were granted in accordance with municipal plans. This is about the same as for the previous years.
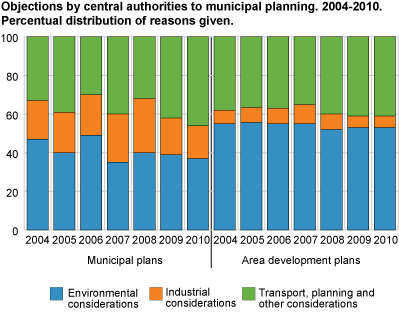
Increase in objections to detailed plans
Norwegian municipalities have a vital impact on the protection and management of the environment through the administration of the Planning and Building Act. To safeguard national interests, other public authorities may object to municipal plans if they are in conflict with national or other vital interests.
Public authorities objected to 48 per cent of all municipal plans and 29 per cent of the detailed plans (area development plans) circulated for consultation in 2010. Compared with 2009 figures, this is an increase in objections to municipal plans, but a decrease in objections to detailed plans. Around 53 per cent of the objections to detailed plans were due to environmental considerations (see figure 2).
KOSTRA does not contain information on the results of these objections. The municipalities may either comply, negotiate with the objecting authority, or a final decision is taken by the Ministry of the Environment.
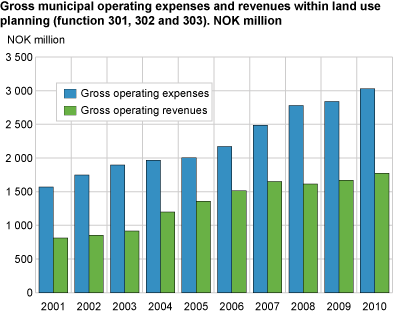
Expenses in land use planning increase
In 2010, gross expenses for land use planning amounted to NOK 3 billion. The municipalities’ gross income covered NOK 1.77 billion of these expenses. From 2009, gross expenses rose by 6.7 per cent, while the gross income increased by 6.2 per cent.
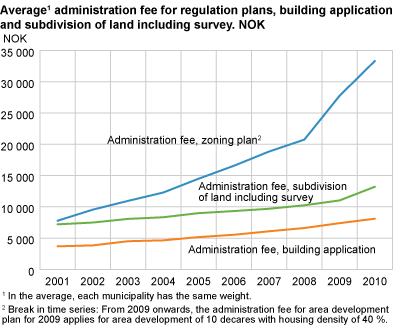
However, administration fees continue to increase. The average fees for private area development plans, building applications and subdivision of land including survey increased last year by 20, 10 and 20 per cent 2 respectively.
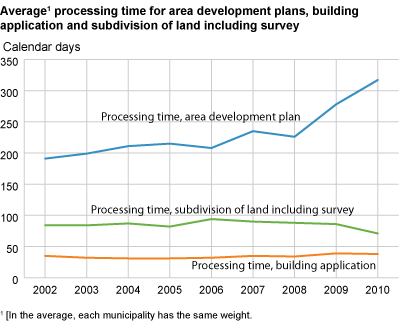
The average processing time for area development plans, building applications and subdivision of land was 317, 38 and 71 calendar days respectively. This is an increase in processing time for area development plans. The reduction for subdivision of land is due to major efforts by the largest municipalities. However, these figures are uncertain.
For general information on KOSTRA, see http://www.ssb.no/english/subjects/00/00/20/kostra_en/ .
See also: Development in the shore zone , and Local environmental efforts in municipalities and county authorities.
(1) Approximately 95 per cent of the municipalities have reported, and the figure is estimated on the basis of these.
(2) This is the average increase in reporting municipalities, where each municipality has the same weight. Total administration fees are however also dependent on the size of the municipality. NB: Break in time series: The administration fee for area development plan for 2009 applies for area development of 10 decares with housing density of 40 per cent.
Tables:
- Table 1 Building project applications in areas of particular environmental value
- Table 2 Average processing time and administration fee for area development plans, building applications and subdivision of land including survey. By inhabitants in the municipality
- Table 3 Case load of regulation plans, building plans and subdivision of land including survey. Weighted average
- Table 4 Share of municipalities with plan for biological diversity, outdoor recreation, preservation of cultural heritage, landscape, universal design and climate/energy. Average age of plans in the year of reporting
- Table 5 Municipal expenses, revenues and investments within land use planning (function 301, 302 og 303)
- Table 6 Applications for exemptions relating to the cultural heritage act and the planning and building act
- Table 7 Number of county authorities with existing plan for a selection of environmental topics. Average age of the plans in the year of reporting
- Table 8 Gross operating expenses, operating revenues and investments in local and regional development - area and nature (function 715). County authorities. NOK 1 000
Find more figures
Find detailed figures from Town and country planning in municipalities and county authorities
Contact
-
Ingeborg Hauge
E-mail: ingeborg.hauge@ssb.no
tel.: (+47) 95 87 66 56
-
Jørn Kristian Undelstvedt
E-mail: jorn.kristian.undelstvedt@ssb.no
tel.: (+47) 94 50 68 64