Content
Published:
This is an archived release.
Exemptions in green areas normally approved
Building projects in areas where building is prohibited require exemptions by the municipalities to be approved. In 2003, 74 per cent of such applications were approved, compared with 70 per cent in 2002. The county councils, which administer the Cultural Heritage Act, approved 74 of all applications for exemptions in 2003, but this is down 10 per cent from 2002.
These results are taken from KOSTRA 2003. The statistics only include exemptions for new buildings. The high level of approval may be partly explained by the practice in some municipalities, where likely rejections are signalled in preliminary negotiations. Such rejections are not included in the statistics. The general ban on building developments in the coastal zone areas does not apply to areas regulated for development. Therefore, the number of exemptions does not give a full picture of the level of development in the coastal zone (see also Development in the coastal zone (1985 - 2004) - Highest activity in urban areas ).
The status of biological diversity, recreation and cultural heritage in municipal land-use planning
A municipality uses the land-use part of the municipal master plan as the basis for safeguarding areas of special value. This can be done in various ways, for example by adopting plans with special focus on environmental assets such as biological diversity, opportunities for outdoor recreation and cultural heritage. Of these environmental assets, the municipalities place greatest emphasis on outdoor recreation, as 60 percent of the municipalities had plans for safeguarding this interest in 2003. Cultural heritage and biological diversity do not seem to be equally important, as only 30 percent of the municipalities had plans for these areas. However, the number of municipalities with plans for biological diversity has increased sharply, from 17 per cent in 2001 to 29 per cent in 2003.
The decisive factor underlying these differences may be the municipalities' perception of their areas of responsibility. Classic nature conservation and cultural heritage conservation have traditionally been regarded as a central government responsibility, while outdoor recreation has, to a greater extent, been delegated to local government
Land use management and municipal finances
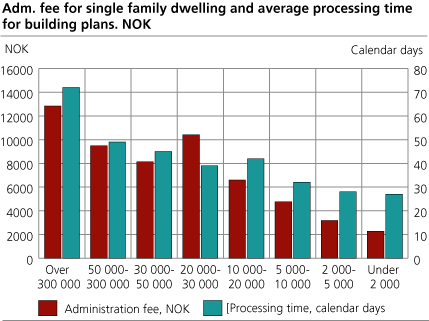
In 2003, the municipalities used fees and other revenues to cover about half of their planning expenses. Net expenses for this purpose accounted for 1.0 per cent of total net municipal operating expenses. This is a substantial increase from the year before, when the figure was 0.74 per cent. The size of the fees increases with the size of the municipality, measured by population. This may be due to the fact that more interests are affected by regulation or building in larger municipalities. There may be a higher number of objections, resulting in higher administrative workload. It is also likely that the initial processing of these cases must be conducted more thoroughly because the considerations are more complex, and in order to avoid or be better prepared for subsequent objections or other complaints. The low fees in relation to the level of expenses in small municipalities may be partly related to the use of low fees as an incentive to attract new businesses.
See also:
Development in the coastal zone (1985 - 2004) - Highest activity in urban areas .
Local environmental efforts in municipalities and county authorities, 2003
Tables:
- Table 1 Building project applications in areas of particular environmental value
- Table 2 Average processing time and administration fee for regulation plans, building plans and subdivision of land including survey, by inhabitants in the municipality
- Table 3 Case load of regulation plans, building plans and subdivision of land including survey. Weighted average
- Table 4 Share of municipalities with plan for biological diversity, outdoor recreation and preservation of cultural heritage. Average age of plans in the year of reporting
- Table 5 Municipal expenses, revenues and investments within land use planning (function 300)
- Table 6 Applications for exemptions relating to the cultural heritage act and the planning and building act
- Table 7 Number of county authorities with existing plan for different topics. Average age of the plans in the year of reporting
- Table 8 Gross operating expenses, operating revenues and investments in local and regional development - area and nature (function 715). County authorities. NOK 1 000
Find more figures
Find detailed figures from Town and country planning in municipalities and county authorities
Contact
-
Ingeborg Hauge
E-mail: ingeborg.hauge@ssb.no
tel.: (+47) 95 87 66 56
-
Jørn Kristian Undelstvedt
E-mail: jorn.kristian.undelstvedt@ssb.no
tel.: (+47) 94 50 68 64