Content
Published:
This is an archived release.
Highest gross domestic product per region in Oslo, Akershus and Rogaland
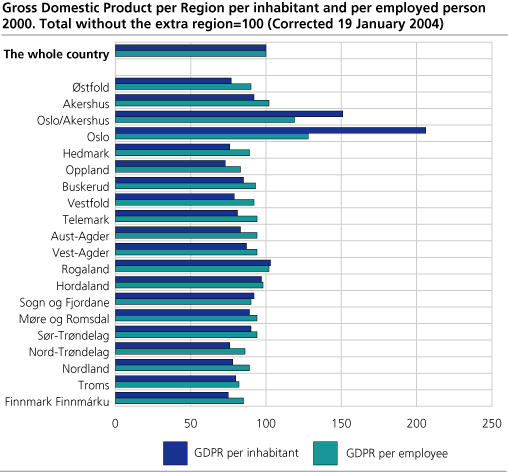
Oslo, Akershus and Rogaland were the only counties with a Gross Domestic Product per Region (GDPR) per employee above the national average in 2000. The lowest GDPR per employee we find in Oppland and Troms, followed by Finnmark and Nord-Trøndelag. The differences reflect regional differences in settlement patterns and industry structure.
Excluding extra region activities (activities at the Norwegian Continental shelf, Svalbard and Jan Mayen and other economic activity abroad, such as embassies, military units, etc.), we find that Oslo, Akershus and Rogaland were the only counties with a GDPR per employee above the national average in 2000. The GDPR per employee for Oslo is 281 per cent above the national average. In contrast, Oppland and Troms are the lowest at 171 per cent below the average GDPR per employee.
The differences in the GDPR per employee are mainly due to differences in the structure of industry. The Gross value added per employee in the primary industries is on average NOK 300 000 on a nation-wide basis, whereas in service industries the amount is NOK 400 000. We find the highest gross value added in the secondary industries, where on average an employee contributes to approx. NOK 500 000 to the overall gross value added. For instance Rogaland, with its relatively high share of secondary industries, has a higher index than Oppland, which has a high percentage of primary industries.
The GDPR per inhabitant varies more than the GDPR per employee. The GDPR per employed person has a more even distribution pattern, since production as well as employment has been distributed according to the county where the producers reside. Persons living in other counties, particularly in Akershus, contribute to a high percentage of the value added in Oslo. Excluding the extra regio only the counties of Oslo and Rogaland had a GDPR per inhabitant above the national average. The GDPR per inhabitant for Oslo was 106 per cent above the national average, while Oppland had the lowest value at 28 per cent below the average.
Gross fixed capital formation per employee
In the same way as for the GDPR per employee, Gross fixed capital formation (GFCF) per employee will vary between counties, mainly as the result of differing structures for industry and thereby differing capital-intensiveness. Oslo and Akershus had the highest GFCF per employee (excluding the extra regio) in all these three years, while Vest-Agder grew most from 1999 to 2000 by comparing with the other counties.1
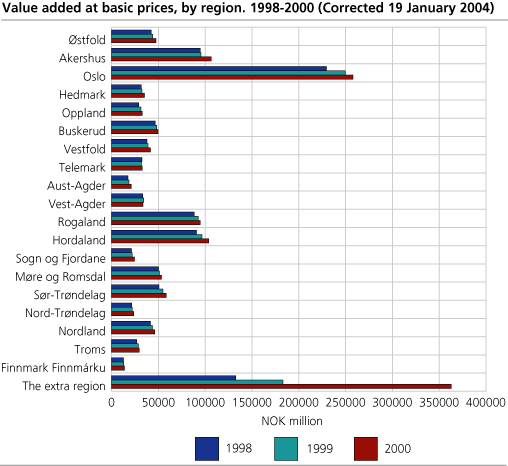
Even growth in GDPR from 1998-2000
GDP at current prices grew respectively by 9 per cent from 1998 to 1999 and about 19 per cent from 1999 to 2000. The figure shows GDPR for the years 1998 to 2000. With few exceptions the figures show an even and moderate growth in GDPR throughout the three years. All counties except the extra-regio have a smaller growth rate in GDPR than GDP. Gross Fixed capital formation is less stable over time than GDPR, and there are large regional differences in the yearly growth rates.
1Corrected 3 June 2003.
Tables:
- Table 1 Main results, Regional accounts 2000, Norwegian counties per inhabitant and per employed person. Total without the extra region = 100 (Corrected 19 Janauary 2004)
- Table 2 Main results, Regional accounts 1999, Norwegian counties per inhabitant and per employed person. Total without the extra region = 100 (Corrected 3 June 2003)
- Table 3 Main results, Regional accounts 1998, Norwegian counties per inhabitant and per employed person. Total without the extra region = 100 (Corrected 3 June 2003)
- Table 4 Gross Value Added by county and industry/main economic activity/Category of producer 2000. Basic value. Mill. NOK (Corrected 02.04.2004)
- Table 5 Gross Value Added by county and industry/main economic activity/Category of producer 1999. Basic value. Mill. NOK (New 3 June 2003)
- Table 6 Gross Value Added by county and industry/main economic activity/Category of producer 1998. Basic value. Mill. NOK (New 3 June 2003)
- Table 7 Primary income and disposable income of households, by region. 2000. Mill. NOK (New 25 September 2003)
- Table 8 Primary income and disposable income of households, by region. 1999. Mill. NOK (New 25 September 2003)
- Table 9 Primary income and disposable income of households, by region. 1998. Mill. NOK (New 25 September 2003)
Contact
-
Edita Zahirovic
E-mail: edita.zahirovic@ssb.no
tel.: (+47) 40 90 26 12
-
Julian Paulsen Blytt
E-mail: julian.blytt@ssb.no
tel.: (+47) 40 90 23 26


