Content
Published:
This is an archived release.
Oslo and Western counties top the GDP
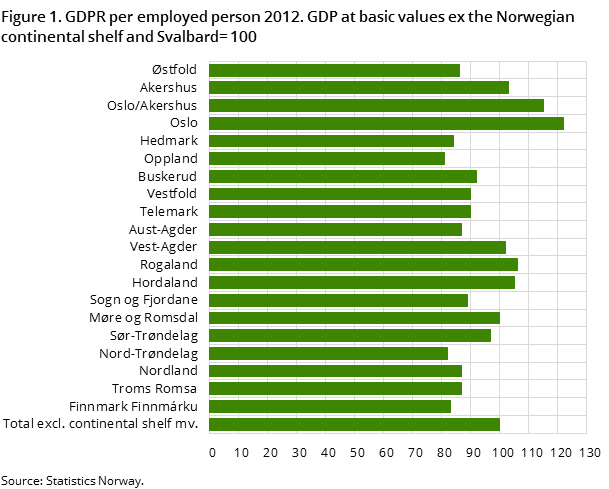
Value added per person employed was at the national average or above in a total of six counties in 2012. As in previous years, Oslo was well above the average. In addition to Oslo, Rogaland and Hordaland and Akershus and Vest-Agder were also above the national average, while Møre and Romsdal was at the national average.
| 2012 | |||
|---|---|---|---|
| GDP per employed persons, index | GDP per inhabitant, index | Household's disposable income per inhabitant, index | |
| Total | 100 | 100 | 100 |
| Østfold | 86 | 70 | 92 |
| Akershus | 103 | 92 | 107 |
| Oslo | 122 | 174 | 111 |
| Hedmark | 84 | 72 | 92 |
| Oppland | 81 | 72 | 93 |
| Buskerud | 92 | 84 | 99 |
| Vestfold | 90 | 76 | 95 |
| Telemark | 90 | 77 | 94 |
| Aust-Agder | 87 | 73 | 92 |
| Vest-Agder | 102 | 96 | 93 |
| Rogaland | 106 | 116 | 106 |
| Hordaland | 105 | 106 | 101 |
| Sogn og Fjordane | 89 | 88 | 95 |
| Møre og Romsdal | 100 | 98 | 97 |
| Sør-Trøndelag | 97 | 96 | 98 |
| Nord-Trøndelag | 82 | 73 | 92 |
| Nordland | 87 | 81 | 95 |
| Troms Romsa | 87 | 85 | 98 |
| Finnmark Finnmárku | 83 | 83 | 97 |


Value added per person employed in Oslo was 22 per cent higher than the national average in 2012. This must be seen in context with the industry structure in Oslo. Oslo is characterised by a large share of service industries with high value added per person employed. About half of all banking and financial services in Norway are located in Oslo. Furthermore, around one third of service industries such as ICT, real estate and technical activities are located in the capital city. Of these four groups, real estate has the greatest value added per person employed in the country as a whole, and in Oslo the value added per person employed was a further 50 per cent higher. The four service groups are not only strongly represented in Oslo, but they are also important for Oslo as they constitute over a third of value added in Oslo.
High level of oil-related activity in Rogaland
Value added per person employed in Rogaland was about six per cent higher than the national average. The industry structure in Rogaland differs from the capital, since the oil-related activity is much greater. Although most of the oil and gas activity occurs on the continental shelf, the land-based activities in connection with the extraction industry are also important for Rogaland. Sixty per cent of this industry is in the county. Rogaland also has a relatively large proportion of industries that supply the oil and gas industry, including services related to oil and gas extraction and technical activities. Along with the land-based activities in connection with the extraction industry, these contributed nearly a quarter to the value added in Rogaland.
Western Counties and manufacturing
Hordaland was five per cent above the national average. Hordaland is not characterised by oil-related activity to the same degree as Rogaland, and a larger proportion of its gross product relates to the financial services, ICT and real estate. The county also has a large manufacturing industry. Hordaland had well over 12 per cent of total industrial production in the country, and manufacturing contributed with almost 12 per cent of value added in the county.
Characteristics of counties with low value added per person employed
The lowest value added per person employed was found in Oppland followed by Nord- Trøndelag and Finnmark. These counties were between 17 and 19 per cent below the national average.
These counties all have relatively high proportions of government services. General government accounted for over 30 per cent of the counties’ value added. In comparison, for the country as a whole, general government constituted about a quarter of total value added.
Value added in general government is conventionally calculated without including return to capital, which is included in market output. This means that the value added per person employed in general government will be lower than, for example, in private services.
Households’ disposable income
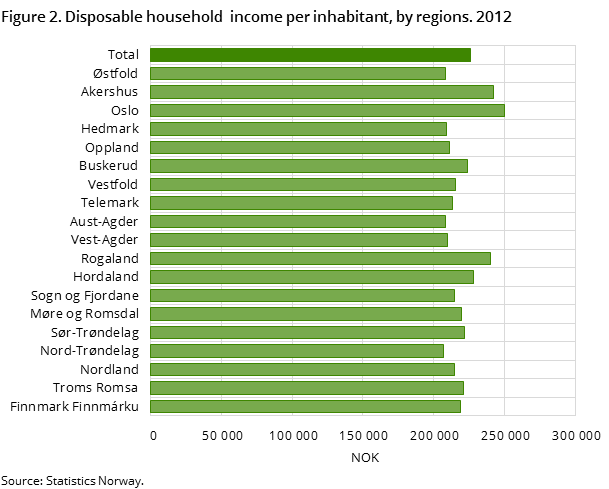
As with the measurement of value added per employed person, Oslo had the highest disposable income per capita. The capital city was eleven per cent above the national average, and disposable income per capita was NOK 250 000.
Nord-Trøndelag had the lowest disposable income per capita, with about NOK 207 000. The figures show that disposable income is more evenly distributed between counties than value added per person employed.
Main revision of the national accountsOpen and readClose
In November 2014 Statistics Norway published main revision of the national accounts to incorporate the updated international guidelines in national standards in 2008 SNA and ESA 2010.. In this instance, we have chosen to revise the year 2011 for the regional accounts figures. We aim to revise back to 2008, so that years from 2008 to 2012 will be comparable.
Contact
-
Edita Zahirovic
E-mail: edita.zahirovic@ssb.no
tel.: (+47) 40 90 26 12
-
Julian Paulsen Blytt
E-mail: julian.blytt@ssb.no
tel.: (+47) 40 90 23 26
