Content
Published:
This is an archived release.
Oslo well above average
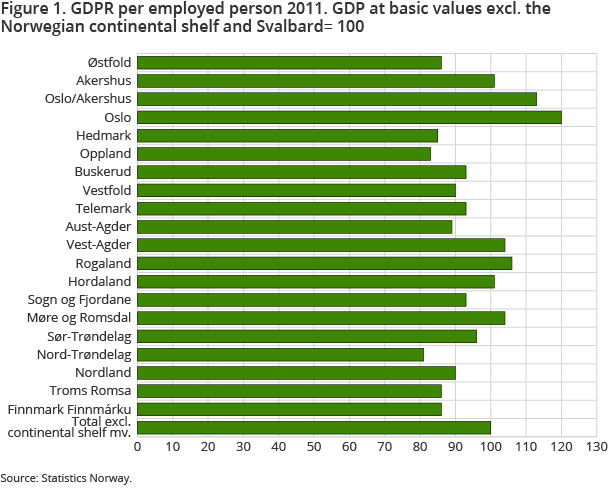
Value added per person employed was highest in Oslo and Rogaland in 2011. Møre og Romsdal, Vest-Agder, Akershus og Hordaland were also above the national average.
| 2011 | |||
|---|---|---|---|
| GDP per inhabitant, index | GDP per employed persons, index | Household's disposable income per inhabitant, index | |
| Total | 100 | 100 | 100 |
| Østfold | 71 | 86 | 93 |
| Akershus | 92 | 102 | 108 |
| Oslo/Akershus | 135 | 113 | 110 |
| Oslo | 174 | 120 | 112 |
| Hedmark | 73 | 85 | 92 |
| Oppland | 74 | 83 | 93 |
| Buskerud | 86 | 93 | 99 |
| Vestfold | 76 | 90 | 96 |
| Telemark | 80 | 93 | 95 |
| Aust-Agder | 74 | 89 | 94 |
| Vest-Agder | 97 | 104 | 93 |
| Rogaland | 114 | 106 | 105 |
| Hordaland | 103 | 101 | 101 |
| Sogn og Fjordane | 92 | 93 | 94 |
| Møre og Romsdal | 100 | 104 | 97 |
| Sør-Trøndelag | 94 | 96 | 98 |
| Nord-Trøndelag | 72 | 81 | 90 |
| Nordland | 83 | 90 | 95 |
| Troms | 85 | 86 | 97 |
| Finnmark | 86 | 86 | 97 |


Value added per person employed in Oslo was 20 per cent higher than the national average in 2011. This must be seen in context of the industry structure in Oslo. Oslo is characterised by a large share of service industries with high value added per person employed. One third of Oslo’s value added comes from financial services, ICT, technical activities and real estate. These service industries contributed to pulling up Oslo’s value added per person employed. Significant shares of these industries are also located in Oslo. For instance, nearly half of the financial and real estate industry resides here. Moreover, the wholesale and retail industry makes up 15 per cent of total value added. The figures show that value added per person employed in wholesale and retail was 80 per cent higher in Oslo than for the country as a whole.
Value added per person employed in Rogaland was about six per cent higher than the national average. The county houses around 60 per cent of the service industries related to oil and gas extraction. In addition, the county has a large portion of the land-based activities related to the extraction industry. In Rogaland, these industries made up around 20 per cent of total value added, and they are characterised by having high value added per person employed.
Value added per person employed in Hordaland, Akershus, Vest-Agder and Møre og Romsdal was between one and four per cent higher than the national average. In Akershus and Hordaland, many of the same service industries pulled the figure up as in Oslo. The industries related to production of electricity generally have high value added per person employed and thus contribute positively in all counties where they are present.
In Vest-Agder and Møre og Romsdal, the manufacturing industries made up about 20 per cent of total value added. The manufacturing industries in these counties are characterised by having high value added per person employed and thereby contributed to pulling up the county totals. In Møre og Romsdal, ocean transport also pulled the figure up; an industry aggregate that among other things contains offshore supply.
High proportion of general government – low value added per person employed
Lowest value added per person employed was found in Trøndelag followed by Oppland, Hedmark, Østfold, Finnmark, Troms and Vest Agder. These counties were between 11 and 19 per cent below the national average.
These counties all have relatively high proportions of government services. General government accounted for around 30 to 40 per cent of the counties’ value added. In comparison, for the country as a whole, general government constituted about a quarter of total value added.
Value added in general government is conventionally calculated without including return to capital, which is included in market output. This means that the value added per person employed in general government will be lower than, for example, in private services.
Public services are labour intensive. The seven counties already mentioned had employment shares of government services at around 35 to 45 per cent. In comparison, for the country as a whole, the share of government services is a third.
Households’ disposable income
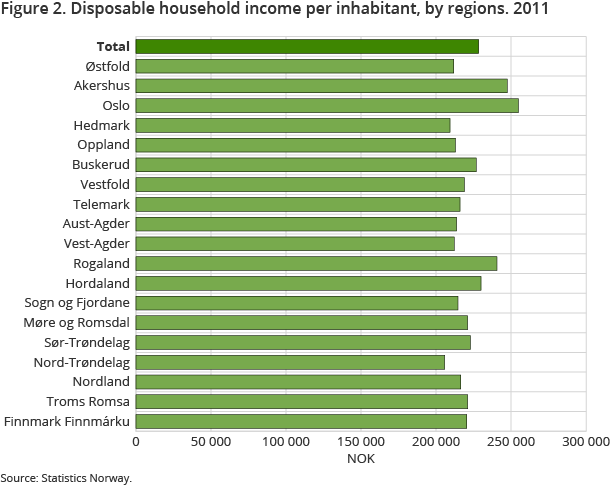
As with the measurement of value added per employed person, Oslo had the highest disposable income per capita. The capital city was twelve per cent above the national average, and disposable income per capita was NOK 255 000. Rogaland had the second highest disposable income per capita, at five per cent above the national average. Wages and salaries are the largest components of household disposable income.
Nord-Trøndelag had the lowest disposable income per capita and was ten per cent below the national average. The disposable income per capita in the county was just over NOK 205 000. The figures show that disposable income is more evenly distributed between counties than value added per person employed.
Planned changes in the national accounts statisticsOpen and readClose
New revised figures for national accounts and related statistics will be published in November and December 2014. Statistics Norway complies with international guidelines in its preparation of national accounts and statistics on foreign affairs. New international guidelines have now been issued for these statistics. Statistics Norway is currently in the process of implementing the changes, in addition to new source data for some of the statistics.
Contact
-
Edita Zahirovic
E-mail: edita.zahirovic@ssb.no
tel.: (+47) 40 90 26 12
-
Julian Paulsen Blytt
E-mail: julian.blytt@ssb.no
tel.: (+47) 40 90 23 26
