Content
Published:
This is an archived release.
One in three households profits from interest rate increase
More than one in three households had higher interest income than interest expenses in 1998. It is basically among elderly households that interest income surpasses interest expenses, although the number of interest earners and payers is about equal in the youngest households in which the main income earner is under 25.
Most households nevertheless have much higher interest expenses than interest income. Interest rates increased rapidly in 1998, causing higher interest expenses for many households. Families with small children have the biggest interest expenses. In 1998 couples with children, in which the youngest child was between the ages of 0 and 6, paid NOK 44 300 in interest charges, NOK 9 000 more than in 1997. Interest in 1998 accounted for about nine per cent of the total household income of this type of household, while the corresponding figure for 1997 was seven per cent. Even though interest took a greater portion of household income it is far to the level of 10 years ago. In 1988 this type of household paid out 22 per cent of its total income in interest.
Rapid income growth in 1998
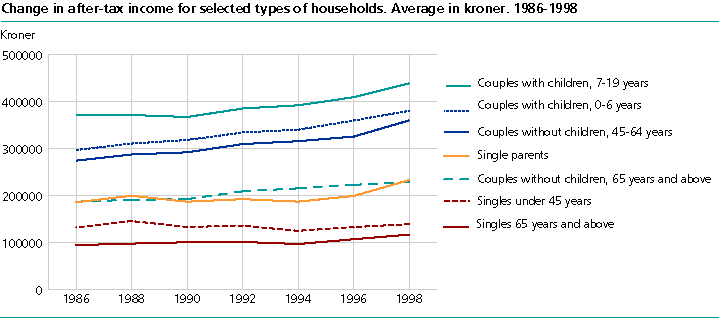
Despite the increases, interest rates did not take as big a bite out of incomes because incomes also increased considerably in the same period. All of the major household groups saw an increase in after-tax income from 1997 to 1998. For the average household, after-tax income increased by nearly NOK 20 000 from 1997 to 1998. Most of this increase is due to wage increases. Households had an average after-tax income of NOK 264 900 in 1998.
From a longer perspective it is couples without children, where the main income earner is between 45 and 64 years of age, that have reaped the strongest income increases. Converted into constant prices, this type of household had an after-tax average income in 1998 that was just over NOK 85 000, or 31 per cent, higher than the corresponding group had in 1986. Other groups that have also had favourable income increases in this period were couples with small children, single parents and pensioners. The group that has had the smallest income increase was young single persons, although this group also had an average income in 1998 that was clearly over the level of 1986.
More debt...
The average debt for all households was NOK 354 000 in 1998. This was an increase of NOK 18 000 from the year before. There are nevertheless large differences between the various types of households. Young families owe the most money. Couples with small children from 0 to 6 years of age had for example debts of NOK 713 000 in 1998. Households with older children also had relatively high debts.
Most households nevertheless have a debt that is in proportion to income. In 1998, 85 per cent of all households had debts that were less than two times their total household pre-tax income. Nine per cent had debts between two and three times income, while six per cent had debts exceeding three times their income. The distribution of debt in proportion to income has changed little in the 1990s.
... and property
Norwegian households had an average assessed value of NOK 330 000 kroner in 1998. This was fully NOK 51 000 more than in 1997. Some of this increase can be explained by changes in the way shares are assessed, in that the so-called share discounts were either reduced (non-listed shares) or completely eliminated (listed shares). However, also other property items increased in 1998. For example, average bank deposits increased by NOK 9 000 from 1997 to 1998.
Households in which the main income earner is between the ages of 55 to 66 have the largest assessed value, with an average of NOK 600 000 in 1998, although households in which the main person was over 66 also had a high net worth.
There are major difference with regard to how the different households save. While shares and other securities account for a large part of the financial wealth of people between 45 and 64, bank deposits are the main financial wealth of pensioners. In 1998, for example, households in which the main person was between 45 and 54 had 37 per cent of their financial wealth in bank deposits, while the majority was made up of shares and other securities. By comparison, bank deposits made up all of 71 per cent of the financial capital of households in the 67 to 79 age range.
Statistical basis
The basis for the income and property statistics for households is a sample of around 15 000 households. When statistics are compiled on the basis of a sample of the population, the sample will from time to time show a different distribution of some variables than the population as a whole would show. This often applies to incomes that very few households have but where the amounts are large, for example some types of capital income.
The 1998 Income Distribution Survey shows that the sample does not show the same distribution of net realised capital gains as the register-based tax return statistics show. The level of this income item in the sample is clearly below that of the register statistics and there are also fewer with large amounts in this income item in the sample compared with the population otherwise. Because it is mainly those with high incomes who have capital gains, the 1998 Income Distribution Survey will underestimate the dispersion in the distribution of capital income and after-tax income.
Cash benefits for families with children aged 1 to 3 years was introduced in August 1998 and the statistics therefore includes the cash benefits paid for five months.
Contact
-
Jon Epland
E-mail: jon.epland@ssb.no
tel.: (+47) 92 61 69 08
-
Elisabeth Løyland Omholt
E-mail: elisabeth.omholt@ssb.no
tel.: (+47) 93 05 55 28
-
Christian Brovold
E-mail: christian.brovold@ssb.no
tel.: (+47) 91 75 31 32
-
Lene Sandvik
E-mail: lene.sandvik@ssb.no
tel.: (+47) 90 13 16 16