Content
Published:
This is an archived release.
Small changes in the distribution of income
A rise in dividends and capital gains contributed to a modest increase in income inequality.
Many households at the top of the distribution experienced a fall in household income in 2009 due to huge capital losses. In 2010, on the other hand, there was a growth in both dividends and capital gains. These are incomes that are mainly received by households at the top of the distribution, and will therefore have an impact on the income distribution.
Stability in the income distribution since 2005
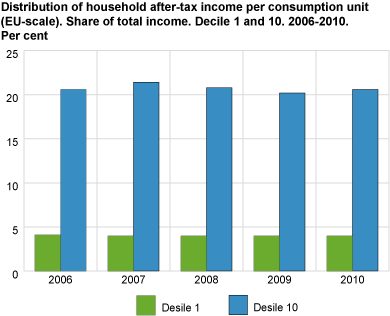
The share of total household income received by the top decile increased from 20.2 per cent in 2009 to 20.6 per cent in 2010. The share of income received by the bottom decile was 4 per cent in 2010. This was the same share as in the previous three years.
In a longer perspective, the income distribution has remained more or less stable since 2005. In 2010, the one fifth of the population with the highest household income had an average income that was 3.3 times higher that the average income of the one fifth of the population with the lowest income. This was the same share ratio as in 2006.
Tables:
- Table 1 Distribution of household equivalent income after taxes, between persons. (EU-scale). Decile shares and cumulative decile shares. 1986-2010. Persons in student households are excluded. Per cent
- Table 2 Measures of income despersion. Household equivalent income (EU-scale) between persons. 1986-2010
- Table 3 Composition of total household income within decile groups for household equivalent income after taxes , between persons. (EU-scale). Share of total income. 1990, 1995, 2000, 2005, 2006, 2007, 2008, 2009 and 2010. Per cent
- Table 4 Household equivalent income (EU-scale), for different percentiles of the income distribution. 2010-NOK.
The statistics is published with Income and wealth statistics for households.
Contact
-
Statistics Norway's Information Centre
E-mail: informasjon@ssb.no
tel.: (+47) 21 09 46 42

