Content
Published:
This is an archived release.
Housing expenditure still the most important
Households spent one fourth of their total consumption spending on housing in 1999-2001, and expenditure on housing was still the most important. Recreation and culture spending exceeded the expenditures on food and non-alcoholic beverages.
Due to small yearly samples is it only possible to publish results from the survey for groups of households when samples for tree years are combined.
Housing is the item taking the largest share of consumption spending, with transport a close second. Recreation and culture is now the third most important household expenditure item, while spending on food is number four.
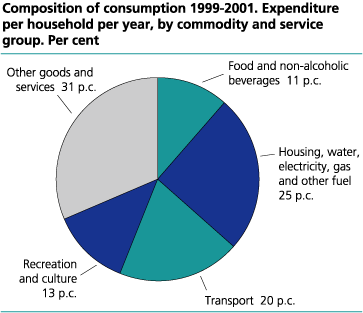
Recreation and culture expenditures exceeded food expenditures
Housing, water, electricity, gas and other fuel make up the largest expenditure item, at NOK 72 795 on average per household per year in the period of 1999 - 2001. This amounts to 25.1 per cent of total spending, that is, approximately one-fourth. Spending on transport appears to have stabilised its share of the total, at around 20 percent on average during the past years. Transport amounted to approximately one-fifth of household spending, at NOK 56 496 in the same period. Food and non-alcoholic beverages used to be the third largest item of household spending, but in the period of 1999 - 2001, the recreation and culture expenditures of households exceeded those of food and non-alcoholic beverages. The average Norwegian household spent NOK 36 101 on recreation and culture, with a share of 12.5 per cent in the period. Food and non-alcoholic beverages comprise on average NOK 33 134 per household per year, or 11.4 per cent in the same period.
Other expenditures were stable
The share of spending on clothing and footwear has been stable over the past years, and represented about six per cent for the average household in the period of 1999-2001. The average household spent NOK 16 960 on clothing and footwear per year in the same period. Furniture and household equipment make up slightly more than 6 per cent of spending on average. An average household spending is stable at a little more than nineteen thousand: For the period it was NOK 19 027. Private expenditure on health care is NOK 8 501 or 2.9 per cent of spending per year in the period. Spending on communication (postage and telephone services) comprises 2.2 per cent of expenditure or NOK 6 288 per year for the average household. Education is a small expenditure item for the average household, at NOK 955 in the period 1999-2001 or 0.3 per cent of spending.
Tables:
- Table 1 Expenditure per household per year, by commodity and service group. 1999-2001. 2001 prices. NOK and per cent
- Table 2 Expenditure per household per year in various types of household, by commodity and service group. 1999-2001. 2001 prices. NOK
- Table 3 Expenditure per household per year in various regions, by commodity and service group. 1999-2001. 2001 prices. NOK
- Table 4 Expenditure per household per year in various areas of residence, by commodity and service group. 1999-2001. 2001 prices. NOK
- Table 5 Expenditure per household per year in groups for size of household, by commodity and service group. 1999-2001. 2001 prices. NOK
- Table 6 Quantity consumption of food and beverages per person per year, by commodity group. 1999-2001. Kg/litre
Contact
-
Knut Linnerud
E-mail: knut.linnerud@ssb.no
tel.: (+47) 99 54 63 12
-
Kristin Egge-Hoveid
E-mail: kristin.egge-hoveid@ssb.no
tel.: (+47) 21 09 47 14