Content
Published:
This is an archived release.
Fewer people go to the public dentist
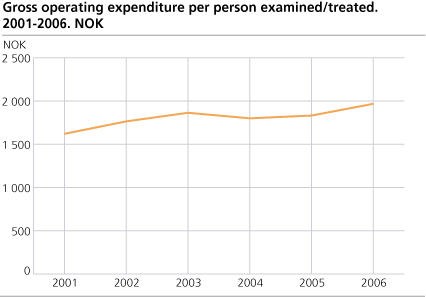
The total number of people examined/treated by public dental health care has decreased, especially among children and youth in the age of 3-18 years. Gross operating expenditure in public dental health care has increased, and therefore the money spent per examined person has increased proportionally.
Between 2005 and 2006, the total number of people treated/examined by public dental health care decreased. This is the first negative trend in the period 2001 - 2006. The decrease is caused by children and youth between 3-18 years of age, but also for youth between 19-20 years of age and mentally ill persons, the number of people treated/examined falls. In the other patient groups the number of people treated/examined increases, for example among elderly, long term ill and disabled.
The new, negative trend does not imply a failing public dental health care. The recommended interval between dental treatments might exceed one year.
| People examined/treated in public dental health care 2001-2006 |
| 2001 | 2002 | 2003 | 2004 | 2005 | 2006 | ||||||||||||||||||||||||||||||||||
|---|---|---|---|---|---|---|---|---|---|---|---|---|---|---|---|---|---|---|---|---|---|---|---|---|---|---|---|---|---|---|---|---|---|---|---|---|---|---|---|
| Whole population examined/treated | 906 981 | 913 152 | 921 391 | 937 533 | 957 680 | 948 431 | |||||||||||||||||||||||||||||||||
| Children 3-18 years examined/treated (A) | 640 316 | 655 027 | 652 990 | 665 678 | 679 721 | 661 974 | |||||||||||||||||||||||||||||||||
| Mentaly disabled above the age of 18 years (B) examined/treated | 11 140 | 11 037 | 11 274 | 11 395 | 11 902 | 11 767 | |||||||||||||||||||||||||||||||||
| Elderly, longterm ill, disabled in institution or home nursing (C) examined/treated | 48 357 | 48 153 | 48 148 | 49 538 | 51 169 | 54 586 | |||||||||||||||||||||||||||||||||
| Elderly, longterm ill, disabled in institution examined/treated | 31 980 | 33 966 | 27 379 | 29 332 | 29 606 | 30 364 | |||||||||||||||||||||||||||||||||
| Elderly, longterm ill, disabled in home nursing examined/treated | 16 377 | 14 187 | 20 769 | 20 206 | 21 563 | 24 222 | |||||||||||||||||||||||||||||||||
| Youth 19-20 years (D) examined/treated | 38 709 | 41 412 | 43 205 | 47 758 | 50 623 | 49 175 | |||||||||||||||||||||||||||||||||
| Prison inmates examined/treated 2 | . | . | . | . | 3 170 | 3 313 | |||||||||||||||||||||||||||||||||
| Other prioritised people (E) examined/treated | 4 369 | 4 387 | 3 697 | 4 840 | 3 323 | 3 850 | |||||||||||||||||||||||||||||||||
| Paying adult clients | 164 090 | 153 136 | 162 077 | 158 324 | 157 772 | 163 766 | |||||||||||||||||||||||||||||||||
| 1 | Rogaland and Hordaland did not separate between group C1 and C2 until 2003. Those to counties is therefore not included in the numbers for C1 and C2. They are included in the numbers for elderly, longterm ill, disabled in institution or home nursing (C). |
| 2 | 2005 was the first year to collect data about dental health care for prison inmates. |
Gross expenditure in public dental health
Despite the decrease in the number treatments, public dental health spends even more money than before. Gross operating expenditure increased by 7.5 per cent from 2005 to 2006. Public dental health spent almost NOK 2000 per person treated/examined last year.
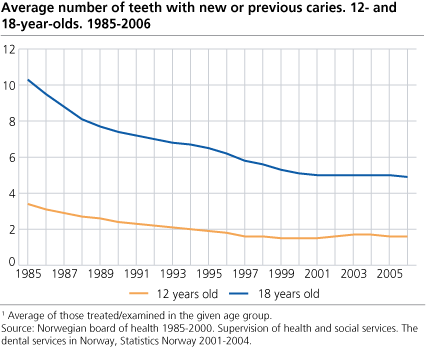
Average caries
The dental health status among 12- and 18 year olds show the same tendency as in the 20 years; less caries.
Tables:
Contact
-
Trond Ekornrud
E-mail: trond.ekornrud@ssb.no
tel.: (+47) 48 13 70 09


