Content
Published:
This is an archived release.
Improvements in dental health care
The public dental health care examines or treats more of its prioritised patients, although the figures vary from county to county. At the same time, however, the improvement in dental health among children has stagnated in recent years.
Certain prioritised groups have the right to public dental health care. The number of prioritised patients under supervision by the public dental health care has increased by about 48 800 to about 1 192 100. To be under supervision by the public dental health care means to undergo a dental health care examination by a dentist or a dental nurse, to receive dental treatment or training in preventive dental care, or to be offered further examinations or treatments. It follows that not all patients are treated/examined during a year. Some are recalled less than once a year, but are under supervision as long as they have been offered further examination/treatment within reasonable time.
| People examined/treated in prioritised groups. 2001-2004 1 |
| 2001 | 2002 | 2003 | 2004 | ||||||||||||||||||||||||||||||||||||
|---|---|---|---|---|---|---|---|---|---|---|---|---|---|---|---|---|---|---|---|---|---|---|---|---|---|---|---|---|---|---|---|---|---|---|---|---|---|---|---|
| Prioritised persons examined/treated | 742 891 | 760 016 | 759 314 | 779 209 | |||||||||||||||||||||||||||||||||||
| Children 1-18 years examined/treated (A) | 640 316 | 655 027 | 652 990 | 665 678 | |||||||||||||||||||||||||||||||||||
| Mentaly disabled above the age of 18 years (B) examined/treated | 11 140 | 11 037 | 11 274 | 11 395 | |||||||||||||||||||||||||||||||||||
| Elderly, longterm ill, disabled in institution or home nursing (C) examined/treated | 48 357 | 48 153 | 48 148 | 49 538 | |||||||||||||||||||||||||||||||||||
| Elderly, longterm ill, disabled in institution examined/treated | 25 963 | 24 769 | 24 175 | 23 256 | |||||||||||||||||||||||||||||||||||
| Elderly, longterm ill, disabled in home nursing examined/treated | 13 230 | 14 187 | 14 961 | 16 451 | |||||||||||||||||||||||||||||||||||
| Youth 19-20 years (D) examined/treated | 38 709 | 41 412 | 43 205 | 47 758 | |||||||||||||||||||||||||||||||||||
| Other prioritised people (E) examined/treated | 4 369 | 4 387 | 3 697 | 4 840 | |||||||||||||||||||||||||||||||||||
| 1 | Rogaland and Hordaland did not separate between group C1 and C2 until 2003. Those to counties is therefore not included in the numbers for C1 and C2. They are included in the numbers for elderly, longterm ill, disabled in institution or home nursing (C). |
A total of 779 200 prioritised patients were examined or treated in 2004. This is an increase of approximately 3 per cent compared with 2003. About 67-68 per cent of all children aged 3-18 have been examined/treated by the public dental health care in recent years. While 90 per cent of 5-year-olds and 12-year-olds were examined/treated in 1990, this applied to 77 per cent in both age groups in 2004. This decline is related to changes in recall intervals as they vary to a greater extent than previously. Some people with bad dental health are recalled frequently, while others are recalled less than once a year.
Elderly, long term ill and disabled
30 per cent of elderly people, people with long-term illnesses and disabled people receiving home nursing were under supervision by the public dental health care in 2003 and 2004. About 18 per cent of the receivers of home nursing were examined/treated in 2004, however, there are substantial differences between counties. While about 8 per cent of elderly, long-term ill and disabled receivers of home nursing were examined/treated in Østfold last year, the figure for Buskerud and Sør-Trøndelag was 28 per cent. A majority of elderly, long-term ill and disabled people in institutions are under supervision by the public dental health care. The figure was 76 per cent in 2004, compared with 80 per cent in 2003. When it comes to examinations/treatments, the figure declined by 2 per cent from 2003 to 2004. Again the variations between counties are considerable: 39 per cent were examined/treated in Hedmark in 2004, compared with 76 per cent in Sogn og Fjordane.
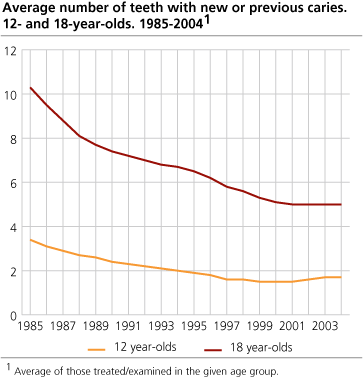
Less improvement in dental health care among children - large variations across counties
The dental health among children, measured as average number of teeth with caries, has improved considerably from 1985 due to the use of fluoride and better dental hygiene. However, this development has stagnated in recent years. It is possible that the changes in recall intervals has had an effect on the figures as people with good dental health sometimes are recalled less frequently than once a year, while people with bad dental health are recalled as frequently as before.
Tables:
- Table 1 Settled man-years in the public dental health care. 2004
- Table 2 Settled man-years. Public dental health care. 2000-2004
- Table 3 Settled man-years in the privat dental health care. 2004
- Table 4 Dentist and spesialized dentists aged 16-66 with foreign citizenship that have been working in Norway less than 5 years. 1. oktober 2004
Contact
-
Trond Ekornrud
E-mail: trond.ekornrud@ssb.no
tel.: (+47) 48 13 70 09