Content
Published:
This is an archived release.
Large fall in use of electricity and biofuel
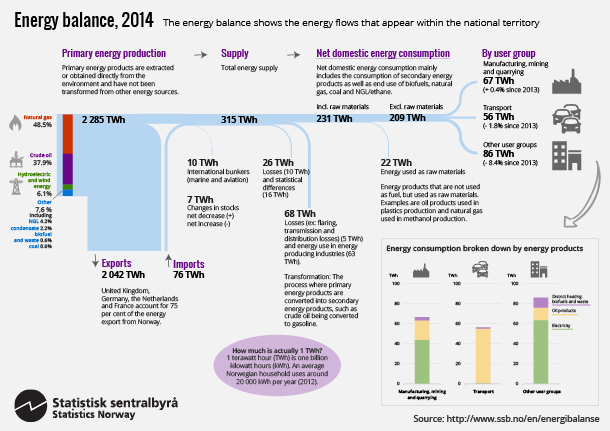
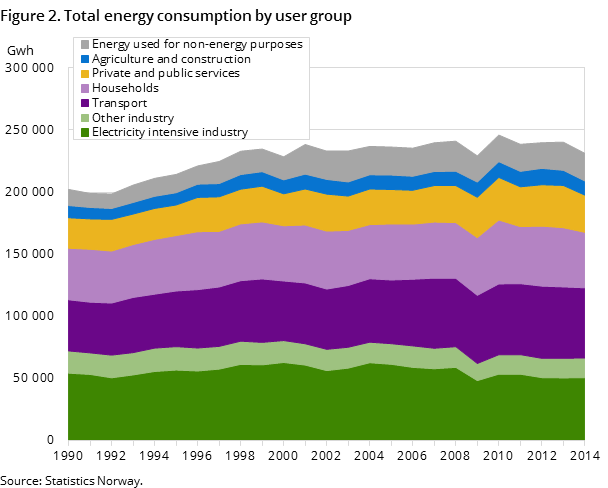
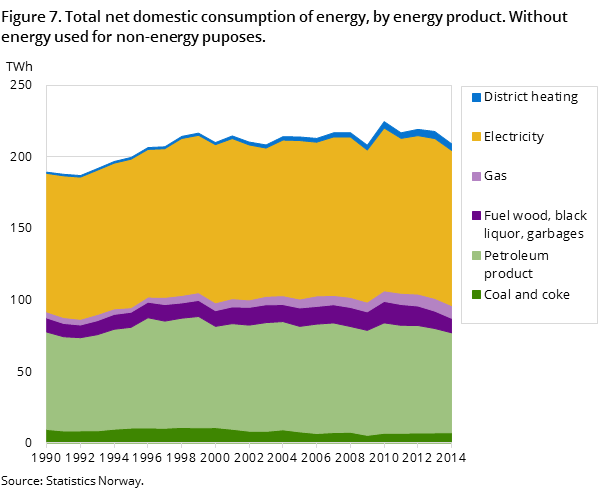
In 2014, the total domestic energy consumption excluding the energy industries and consumption of raw materials was 209 TWh. This is 4 per cent lower than the year before. There was a particularly large decline in energy consumption in households and the service sector, which is clearly associated with the record high temperatures in 2014.
| All energy products | Change in per cent | ||
|---|---|---|---|
| 2013 | 2014 | 2013 - 2014 | |
| Primary energy production | 2 265 | 2 285 | 0.9 |
| Imports | 96 | 76 | -21.2 |
| Exports | 2 014 | 2 042 | 1.4 |
| International bunkers (marine and aviation) | 11 | 10 | -9.2 |
| Changes in stocks (+ = net decrease,- = net increase) | 1 | 7 | 637.0 |
| Total energy supply | 337 | 315 | -6.5 |
| Energy industries own use and energy converted | 65 | 68 | 5.1 |
| Losses and statistical differences | 40 | 26 | -34.4 |
| Final consumtion including non-energy use | 240 | 231 | -3.7 |
| Non energy use | 23 | 22 | -1.9 |
| Final consumtion excluding non-energy use | 218 | 209 | -3.9 |
| Manufacturing, mining and quarrying | 66 | 67 | 0.4 |
| Transport | 57 | 56 | -1.8 |
| Other sectors | 94 | 86 | -8.4 |
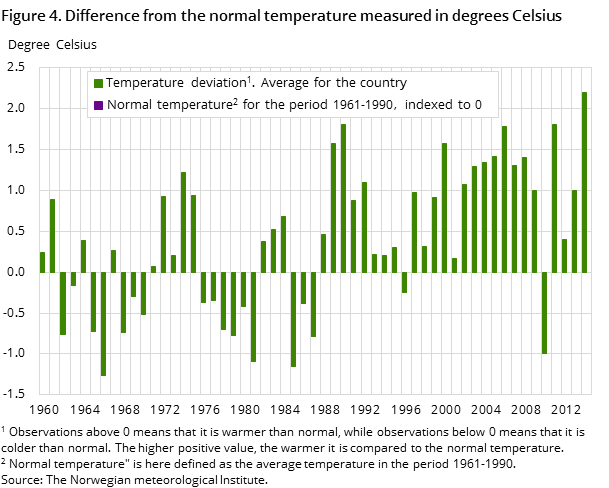
According to the Norwegian Meteorological Institute, 2014 is the hottest year in a time series that dates back to 1900, with a temperature of 2.2 degrees above what is considered the normal temperature. In the last 15-year period, the energy consumption has only been lower in 2003, and then again in 2009 when the financial crisis affected both the world economy and energy use.
Higher energy production, but lower energy consumption
Norwegian oil and gas production increased in 2014 by approximately 1 per cent from the previous year. Production of crude oil increased by approximately 3 per cent from the previous year, while the natural gas production decreased by 0.3 per cent. There was also a 6 per cent increase in the production of electricity in 2014.
In 2014, the Norwegian energy export totalled 2042 TWh, which is almost 10 times more than the domestic energy consumption excluding the energy industries and consumption of raw materials.
Large drop in energy consumption by households and services
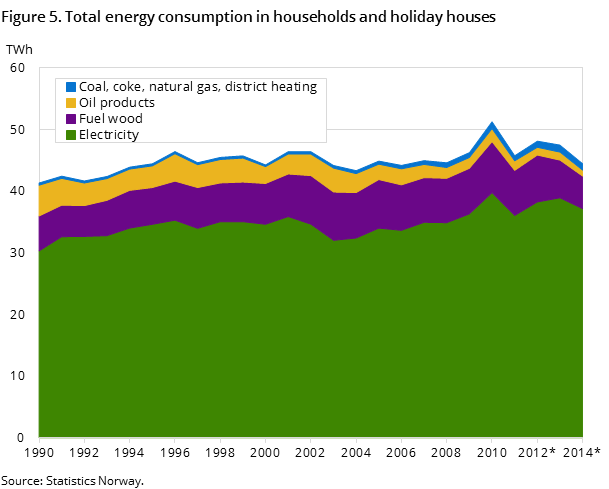
Energy consumption by households and services combined decreased by 9 per cent in 2014 compared to the previous year. The record high temperatures in 2014 were the main reason for this decline, since a large proportion of the energy consumption in these user groups relates to heating. Electricity accounts for 80 per cent of the energy consumption in these groups, and the electricity consumption decreased by 8 per cent in 2014. There was also a decline in the consumption of kerosene and fuel oil by 17 per cent for these two user groups combined. Households and services’ district heat consumption decreased by 8 and 5 per cent respectively .
Less consumption of wood, but more burnt in clean-burning stoves
In 2014, 12 per cent of the energy consumption in households was with wood. In total, 1.1 million tonnes of wood was used, of which 0.9 million tonnes was burned in private residences and 0.2 million tonnes was burned in holiday cottages. Compared with the previous year, 2014 saw a decrease in wood consumption in private residences and holiday cottages by 14 per cent. More than half of the wood consumption (56 per cent) was burned in clean-burning stoves. Clean-burning stoves are more energy efficient than older stoves manufactured prior to 1998, which means that more of the energy is utilised.
Small changes in energy use in the manufacturing industries
The total energy use for manufacturing industries, excluding refineries, was almost at the same level in 2014 as in 2013. Although the total energy use for the manufacturing industries only increased by 0.4 per cent in 2014, the development varied significant for different manufacturing industries and among the different energy products. There was a large decrease in the use of biofuels in the manufacturing industries. The 30 per cent drop in 2014 is related to closures in the manufacture of paper and paper products. Energy used in the manufacture of paper and paper products dropped by 24 per cent, which was mainly due to less use of wood chips and black liquor etc. There was a total decline in the use of oil products and natural gas in the manufacturing industries of 7 and 3 per cent respectively, while consumption of electricity rose by about 5 per cent in 2014. Consumption in other energy-intensive manufacturing industries rose however in 2014 by almost 4 per cent from the previous year.
Less use of biofuel for wood processing and heating...
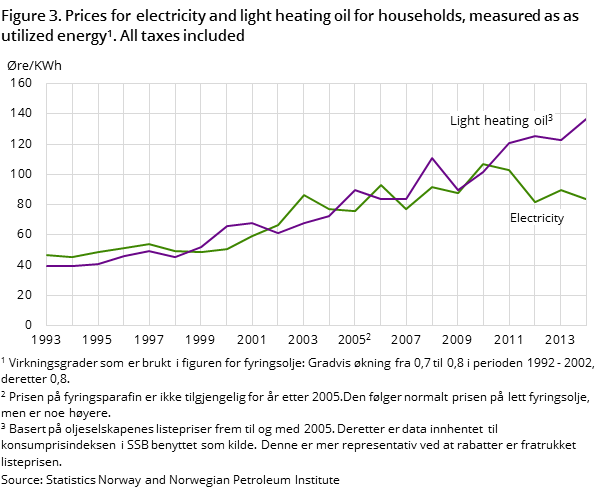
Consumption of wood and other biomass fuels such as wood chips and pellets decreased by 17 per cent in 2014 compared with the previous year. Biofuels are an important energy product in both households and in the manufacture of paper and paper products. Consumption of biofuels in Norway peaked in the relatively cold year of 2010, with around 15 TWh, but since then has dropped sharply. In 2014, the consumption of biofuels was approximately 10 TWh, which is the lowest consumption of biofuels since 1993. This is due to the mild 2014 winter in addition to the closures in the manufacture of paper and paper products. It may also be related to households having acquired heat pumps, which are often used as a substitute for wood stoves. Moreover, there has been a fall in electricity prices since 2010, making it cheaper to use heat pumps and electricity.
... but increased use of biofuels for transport
The use of biofuels for transport purposes has increased since it was first introduced in 2006. In 2006, the use of biofuels was 0.06 TWh. This energy use was around 1.5 TWh in both 2013 and 2014, and has curbed some of the decline in the total biofuel consumption.
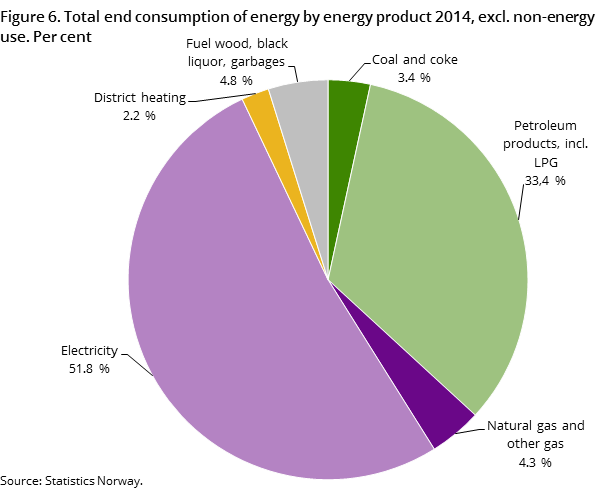
Total consumption of biofuels amounted to no more than 5 per cent of net domestic energy consumption in 2014, but is nevertheless important for fulfilling the commitments in the Renewable Energy Directive.
Drop in total energy consumption for transport purposes
The total energy consumption for transport purposes fell in 2014 by 2 per cent from the previous year. Consumption for road transport accounts for 75 per cent of total domestic consumption for transport purposes. Of this, the diesel consumption for freight and passenger cars is slightly over 70 per cent. Consumption of gasoline has fallen sharply in the last 10-year period, while use of diesel has risen. In 2014, gasoline consumption also decreased, by about 5 per cent from the year before. Consumption of diesel rose by 0.4 per cent, but it was not enough to offset the decline in gasoline consumption.
In 2014, total energy consumption for road transport decreased by almost 1 per cent from the previous year. There was also a reduction in energy use for coastal transport of 8 per cent from the previous year. Use of electricity for electric vehicles is increasing. An estimated consumption in 2014 was around 65 GWh, which is equivalent to 0.15 per cent of total energy use for land transport. In these statistics, this consumption is not counted under transport, but is included in the figures for households and the service sector since that is where these cars are recharged.
In previous years, figures for the energy balance and the energy account were published in one article. In order to better highlight the developments in these two different ways of displaying the energy production and consumption, analyses of the figures are now published in two different articles. In this article, figure for the energy balance have been presented. Figures for the production and consumption of energy according to Norwegian economic activity, including energy intensities, are presented in the energy account.
Contact
-
Malin Bjelvert
E-mail: malin.bjelvert@ssb.no
tel.: (+47) 40 81 15 02
-
Sigrun Kristoffersen
E-mail: sigrun.kristoffersen@ssb.no
tel.: (+47) 48 00 21 92
-
Ann Christin Bøeng
E-mail: ann.christin.boeng@ssb.no
tel.: (+47) 40 81 13 58

