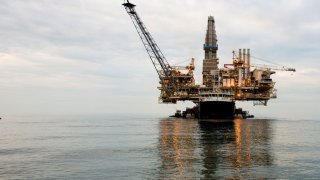
The Norwegian oil and gas industry is impacted by the pandemic. Preliminary figures for extraction and related services show a decrease in Turnover corrected for changes in stock of finished goods, work in progress and goods and services bought for resale. of 13,8 per cent in 2020. However, the decline is smaller than in 2019, when production value fell by 18,5 per cent. The industry has now faced two years of decline since having a strong year in 2018.
Stable employment in the extraction industries
Employed persons: Sum of owners and employees. Those with more than one job may be counted in more than one industry. The employment figures show an annual average of the number in employment. in the In this article extraction industries refer to extraction of oil and natural gas including transport via pipelines. is generally more stable than production value and Production value less the purchase of goods and services (for other goods and services than those purchased for resale), and special public taxes, corrected for changes in stocks of raw materials and consumer goods. Special public subsidies for manufactured/sold merchandise and other public subsidies/reimbursements are included., and increased by 2,5 per cent in 2020. With that, employment has seemingly stabilized since facing two years of decline from 2015 to 2017. The In this article support industries refer to support activities for petroleum and natural gas extraction. had a small decrease in employment of 0,2 per cent in 2020, after a strong increase of 12,0 per cent in 2019.
The support industries hold strong
Value added in the extraction industries fell with the production value in 2020. This variable is usually used as a measure of value creation, and has fallen to a level not reached since 2004. The decline is not explained by changes in Value of the goods and services consumed as inputs in the production process, excluding fixed assets whose consumption is recorded as consumption of fixed capital., which fell by 3,0 per cent.
Despite the close relationship between the support and extraction industries they rarely march to the same tune. In 2015 and 2016 the extraction industries saw the effect of lower oil prices with an immediate decrease in value added of 19,0 and 17,7 per cent respectively. The support industries on the other hand had a modest decrease in 2015 of 1,2 per cent. Not until 2016 did they suffer markedly as value added fell by 22,6 per cent. The decline continued for the support industries, while the extraction industries had a great period in 2017 and 2018. In those years value added rose 27,1 and 30,6 per cent respectively in the extraction industries.
For the last two years the support and extraction industries have once again swapped roles. The extraction industries had two tough years in 2019 and 2020, while the service industries had a strong increase in value added of 30,0 and 21,3 per cent respectively. The increase, from 37 billion in 2019 to 45 billion in 2020, means that the support industries have cleared the level they fell to in 2016.
Production value is the driver of changing value added in the support industries as well. Production value increased by 10,0 per cent from 123 billion in 2019 to 136 billion in 2020. Intermediate consumption increases by 5,1 per cent from 86 billion in 2019 to 91 billion in 2020. Since this increase is lower than the increase in production value, the value added increases more than the increase in production value alone, in percentage terms.