The business tendency survey for the second quarter of 2021 shows growth in total output compared to the first quarter. The producers of Covers industries such as wood and wood products, paper and paper products, basic chemicals and basic metals. Often referred to as traditional export industries. and Covers industries such as food products and beverages, printing and reproduction, pharmaceuticals and furniture. are experiencing a clear increase in production, while producers of Covers industries such as machinery and equipment, ships, boats and oil platforms, repair and installation. Often referred to as the engineering industry. report a more moderate growth in production volume. There are still some of the industrial leaders who report that production in the second quarter has been limited by corona- related conditions such as restrictions on entry into Norway, local outbreaks of infections and lack of access to raw materials and other input factors.
Industrial leaders report that total industrial employment in the second quarter has increased compared with the first quarter. Producers of consumer goods report a clear growth in employment, while producers of intermediate goods and capital goods report a more moderate increase in employment.
Growth in total stock of orders
The total stock of orders in manufacturing shows a clear growth in the second quarter, but there are differences in the development for the different types of goods. Producers of intermediate goods and consumer goods have a marked increase in stock of orders in the second quarter, while the producers of capital goods report unchanged stock of orders. The industrial leaders also report clear growth in new orders for the domestic market and a somewhat more moderate growth in the export market. Producers of intermediate goods report a clear growth in new orders in both markets, Producers of consumer goods report a clear growth in new orders from the domestic market and a more moderate growth from the export market in the second quarter. For capital goods it is a different development for the two markets; it is reported a growth in new orders from the domestic market and a decline in new orders from the export market.
Industrial managers report a clear growth in the price level both in domestic and export market for overall manufacturing in the second quarter. Price growth is reported for all types of goods in both markets. Producers of intermediate goods report strong growth in prices for sales in both markets. For producers of consumer goods report a clear increase in prices for sales to both markets while the price growth reported by the producers of capital goods are more moderate, especially in the export market.
Positive expectations for the third quarter of 2021
The general outlook for the third quarter of 2021 is overall positive, and the proportion with an optimistic view for the coming quarter is clearly higher than in the previous survey. Although producers of all good types have positive expectations, it is producers of intermediate goods who have the most optimistic view related to the third quarter. The industrial managers further report that the total production volume is expected to grow compared with the second quarter. Employment growth is also expected in the coming quarter. It is reported that adopted investment plans are marginally adjusted upwards, and that new orders from both the domestic and export markets will increase further. It is expected growth in the total stock of orders. The strength of the expected growth for the various indicators is not the same for the different good types. Generally, the strongest growth is expected for producers of intermediate goods, while the expected growth is weakest for producers of capital goods.
The industrial confidence indicator is clearly positive
This is the average of the responses (balances) to the questions on expected volume of production, total stock of orders and inventories of own products for sale (the latter with an inverted sign). See Definitions in ‘About the statistics’ for further details. in the second quarter was 11.3, (Figures that are adjusted for calendar effects and seasonal variation. Such adjustment gives a more accurate picture of the underlying trend in the time series, and makes it easier to compare the results of subsequent quarters. up from 8.6 in the previous quarter. The indicator is now well above the historical average and this indicates growth in production volume for the third quarter of 2021.
The industrial confidence indicator is clear positive for most of the producers of both intermediate goods and consumer goods, while it is only slightly positive for the producers of capital goods.
Values above zero indicate that total output will grow in the forthcoming quarter, while values below zero indicate that total output will fall. International comparisons of the industrial confidence indicator are available from Eurostat(EU), The Swedish National Institute of Economic Research and Statistics Denmark.
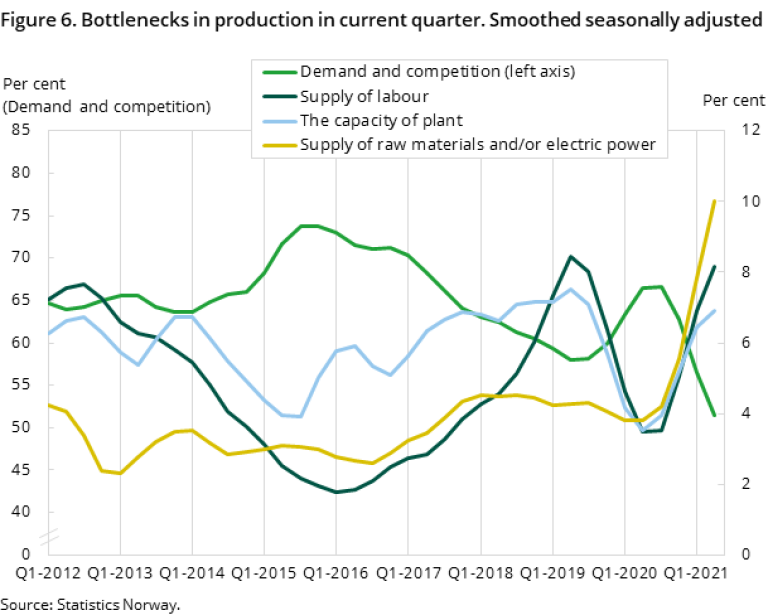
Access to labor limits production
Compared with the previous survey, there are a higher proportion of industry leaders who highlight that the lack of qualified labor and supply of raw materials and/or electric power are factors that contributed to limiting production in the second quarter of 2021. At the same time, a lower proportion of industry leaders point out that weak demand and strong competition have limited production.
The average How much of the available production capacity is utilised. A high capacity utilisation means that it is difficult to produce more without investing, while a low capacity utilisation means having capacity that is not being used. for Norwegian manufacturing is slightly higher than in the previous quarter, and it was calculated to 79.8 per cent at the end of the second quarter of 2021. The capacity utilisation is now only a little below the historical average of 80.0 per cent. International comparisons of average capacity utilisation are available from Eurostat (EU).
Timelines
The survey data was collected in the period from 9 June 2021 to 20 July 2021.
Indicators for the 2nd quarter of 2021: The business tendency survey for the second quarter of 2021 will provide a current picture of the economic situation for industry, mining and quarrying. This is achieved by mapping out business leaders’ evaluations of the economic situation and the outlook for a fixed set of indicators. The measurement period was from 9th June to 20th July 2021.