Content
Published:
Next release:
The figures in the Statbank tables for 2015 were updated 28.06.2016 and this causes some minor deviation from the 2015-figures published in the article 23. 06.2016.
Municipal housing increasing
There has been an increase in the number of municipal houses in 2015. More people with a refugee background have also moved into municipal housing for the first time.
| 2011 | 2012 | 2013 | 2014 | 2015 | |
|---|---|---|---|---|---|
| Total number of municipal disposed dwellings | 96 403 | 103 164 | 105 144 | 105 567 | 107 129 |
| Dwellings with municipal right of disposal, per 1 000 inhabitants | 20 | 20 | 21 | 20 | 21 |
| Share of municipal dwellings accessible for wheelchair users | 46 | 47 | 48 | 48 | 48 |
| Net operating expenditures, public housing and related services, per capita in NOK | -10.8 | -2.5 | 42.0 | 21.7 | 60.4 |
| Gross operating expenditures, public housing, per dwelling with municipal right in NOK | 48 492 | 46 700 | 50 537 | 55 088 | 59 275 |

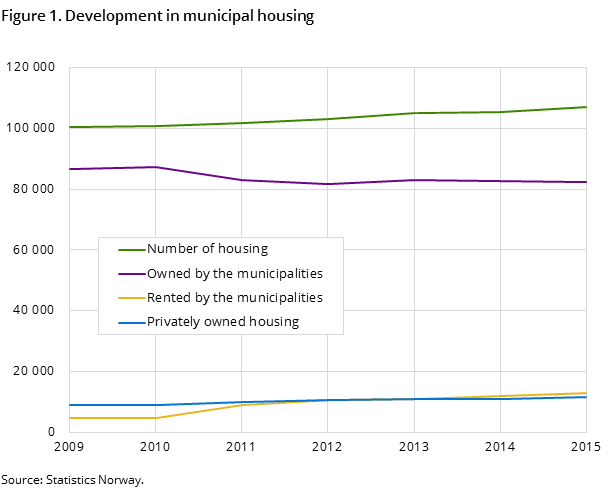
In Norway, there were 107 129 municipal houses in 2015; 1 562 more than in 2014. Most of these houses, about 77 per cent, are owned by the municipalities themselves, a slight decrease from 2014. The municipalities rented 12 per cent of the houses in 2015, and privately owned houses used by the municipalities constituted 11 per cent or 11 710 of the houses in 2015 (see figure 1).
Norwegian municipalities received 38 478 applications from households in 2015. This is an increase of nearly 3 per cent compared with the year before when 37 464 applications were received.
Almost 9 per cent fewer households lived in temporary housing in 2015 compared with 2014. In addition, 26 per cent of the new settler households were given municipal housing in 2015 because they were made up of refugees, and less than 9 per cent were given municipal housing because of mental illness. More than 6 per cent were given municipal housing in 2015 because of substance abuse, which is a decrease from the year 2014. Five per cent of the households receiving municipal housing were also suffering from a combination of mental illness and substance abuse, which is the same level as in 2014. In total, the group with mental illness and/or substance abuse has decreased from 22 per cent in 2014 to 20 per cent in 2015.
Sixteen per cent of households with other problems were given municipal housing in 2015, which is the same level as in 2014. More than 34 per cent of the households with a need for wheelchair accessible housing were given municipal housing. Less than 4 per cent of the households were given municipal housing without means testing.
Contact
-
Unni Beate Grebstad
E-mail: unni.grebstad@ssb.no
tel.: (+47) 94 50 68 66
-
Wasif T. Hussain
E-mail: wasif.hussain@ssb.no
tel.: (+47) 21 09 43 95
