Content
Published:
This is an archived release.
NOK 4.3 billion on fire and accident protection in municipalities
In 2012, local authorities spent NOK 4.3 billion on fire and accident protection. Most of the expenditure relates to the preparedness in local authorities, while a fifth was spent on prevention. Furthermore, the number of fires in buildings has decreased from 2011 to 2012.
| 2012 | 2011 - 2012 | 2008 - 2012 | |
|---|---|---|---|
| Absolute figures | Percentage change | Percentage change | |
| Gross operating expenditure | |||
| Totalt expenditures, function 338 og 339 | 4 387 052 | 4 | 18 |
| 338 Prevention of fires and other accidents | 865 118 | 9 | 30 |
| 339 Preparedness for fires and other accidents | 3 521 934 | 2 | 15 |
| Net operating expenditure | |||
| Totalt expenditures, function 338 og 339 | 3 265 175 | 4 | 18 |
| 338 Prevention of fires and other accidents | 259 344 | 18 | 27 |
| 339 Preparedness for fires and other accidents | 3 005 831 | 3 | 17 |
| Per 1000 inhabitants | Percentage change | Percentage change | |
| Man-years | |||
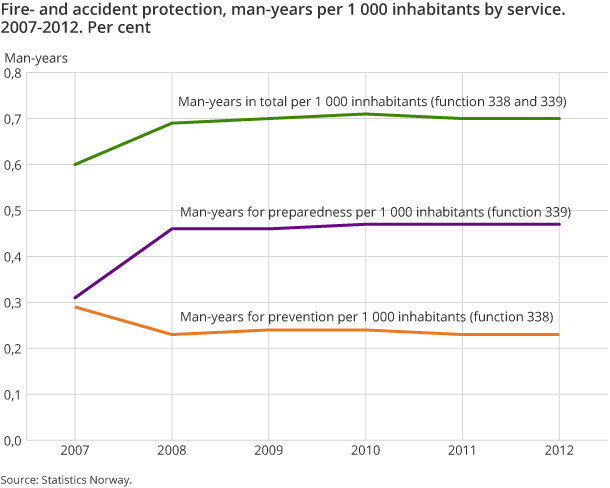
| Man-years, fire and accident protection per 1000 inhabitants | 0.7 | 0 | 0 |
| Man-years, preventive measures against fires and other accidents per 1000 inhabitants | 0.24 | 4 | 4 |
| Man-years, preparedness for fires and other accidents per 1000 inhabitants | 0.50 | 6 | 9 |
| Absolute figures | |||
| Activity | |||
| Total number of fires in buildings | 4 281 | -15 | 56 |
| The number of chimneys being swept last year | 752 281 | -2 | 3 |
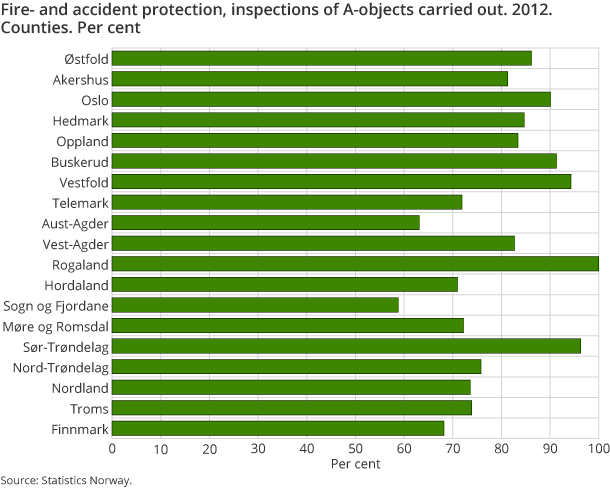
| The number of A-objects inspected last year | 18 643 | -8 | 13 |
Higher expenditure
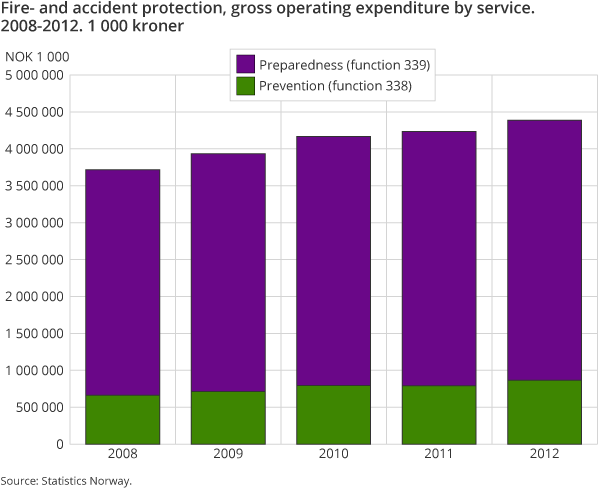
Measured by gross operating expenditure, local authorities’ expenditure for fire and accident protection has increased from 2011 to 2012. In 2012, local authorities spent a total of NOK 4.3 billion in this area, which represents a 2 per cent increase from 2011. Moreover, the expenditure has increased by 16 per cent from 2008 to 2012.
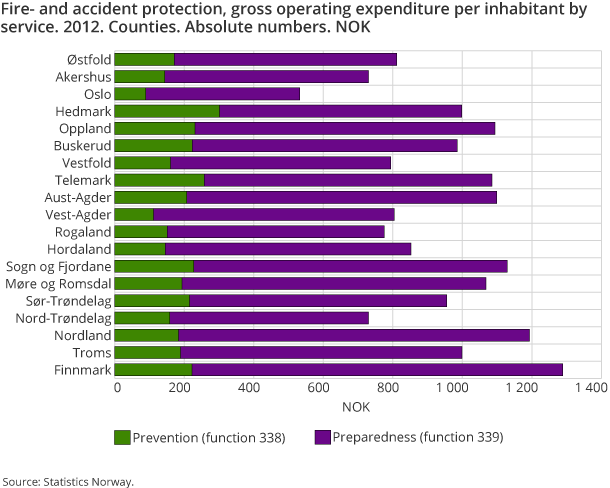
Measured by gross operating expenditure per inhabitant, figures show that the expenditure has increased from NOK 849 in 2011 to NOK 854 in 2012. By comparison, the gross operating expenditure per inhabitant in 2008 amounted to NOK 775.
The major item of expenditure within fire and accident protection is preparedness for fires and other accidents. Among other things, this includes operating expenditure for the fire brigade and emergency systems to combat oil pollution. In 2012, the gross operating expenditure for this item totalled about NOK 3.5 billion, which is an increase of 1 per cent from 2011 and 13.7 per cent from 2008.
The municipal expenditure within prevention of fires and other accidents is significantly lower than expenditure on preparedness, but over time the prevention expenditure is increasing the most. In 2012, local authorities spent approximately NOK 842 million on prevention in the form of chimney sweeping and other actions to prevent fires and explosive accidents, which is an increase of 6.4 per cent from 2011 and 27 per cent from 2008.
Decrease in number of fires
There has been a decrease in the number of fires involving buildings in Norway from 2011 to 2012. In 2012, a total of 4 281 building fires were recorded, which represents a decrease of about 11 per cent from 2011. In terms of fires by population, there were 1.4 building fires per 1 000 inhabitants in 2012, which means a decrease of 0.3 building fires per 1 000 inhabitants from 2011.
Of all the building fires in Norway, house fires constitute the biggest share. Every year, 7 out of 10 building fires are house fires. In 2012, this meant that 2 802 out of the 4 281 building fires were house fires.
Contact
-
Linda M. Allertsen
E-mail: linda.allertsen@ssb.no
tel.: (+47) 97 09 97 51
-
Trond Ekornrud
E-mail: trond.ekornrud@ssb.no
tel.: (+47) 48 13 70 09


