Content
Published:
This is an archived release.
Highest income in Akershus and Oslo
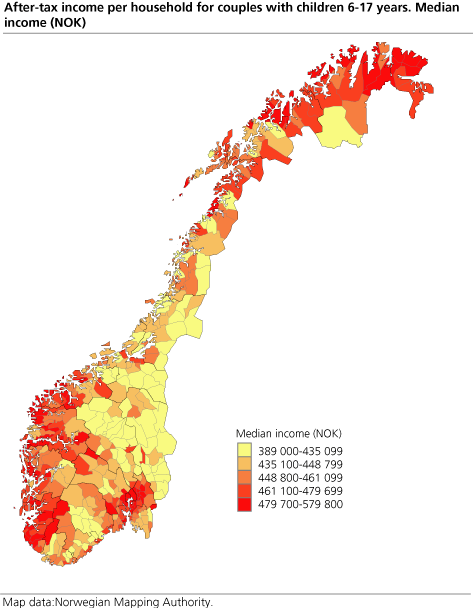
For all types of households the average after-tax income is highest in the counties of Akershus and Oslo. Rogaland is also above the national average, while households in Nord-Trøndelag, Hedmark and Oppland have the lowest average income.
There is substantial regional variation in after-tax income for households for 2001. The average after-tax income for households is described by the median
Differences between types of households
There is substantial variation in median income by types of households. The national average for persons living alone is NOK 152800 . For mother/father with children the median income is NOK 249200 and for couples without resident children NOK 319000 . For other types of households, the median income is in the range of NOK 420000 to 480000.
This variation in income between household types also affects the regional distribution of total median income. For instance, since Oslo has a very high proportion of one-person households, the total average income for all households is the lowest among all counties. If we look at Oslo's household types individually, however, their incomes are among the highest.
Differences across counties
There is substantial variation in median income across counties. For one-family households without children 0-17 years old, there is a 30 per cent difference between the counties with the lowest and the highest income. For one-family households with children 0-17 years old and multi-family households, the difference is approximately 20 per cent.
Akershus has the highest median income for all types of households except for one-person households and couples without resident children, where Oslo is at the top. Rogaland is also above the national average for all types of households. In Finnmark, households with children 0-17 years old and couples without resident children have a high average income. Nord-Trøndelag, Hedmark and Oppland have the lowest average income.
Differences across municipalities
The differences between municipalities are of course greater than between counties. For instance, for couples without resident children, the municipality with the highest median income is 72 per cent above the municipality with the lowest income.
For all types of one-family households, most municipalities with high median income are found in the greater city regions, and especially in the Oslo region. Municipalities with larger towns also have high median income. Municipalities with the lowest income are mainly small and remote.
Huge variations in Oslo
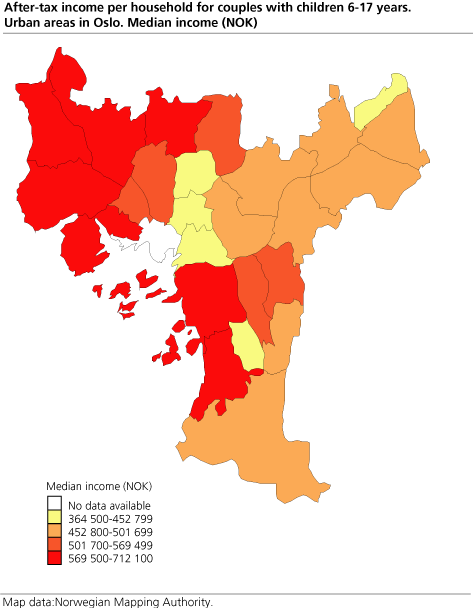
There is substantial variation in median household income between urban areas in Oslo. For all types of households the income is highest in the western parts of the city. The difference is smallest for one-person households and largest for couples with children 0-17 years old and one-family households with adult children. For instance, the average income for couples with children 0-17 years old in Vinderen is almost twice the income in Gamle Oslo.
Low income for the elderly
For households where the oldest person is 67 years or older, the median income is much lower than for other households. One-person households under 30 years of age have lower median income than one-person households between 30 and 66 years of age. This variation also affects the regional distribution of income.
Large households have highest income
The average income increases with the size of the household. The regional pattern for distribution by household size is very similar to the pattern for household types. The reason for this is that there is a strong correlation between household size and type of household.
The data on after-tax income are the same as the data used in the income and property statistics for households in 2001. Here the data have been combined with household data from the Population and Housing Census 2001, making it possible to publish income statistics for counties, municipalities and urban areas. The statistics are based on registered addresses according to the population register 3 November 2001. This means that students who are registered at the their parents' address are included in their parents' household. |
Tables:
- Table 1 After-tax income for private households, by type of household, county, municipality and urban district. Median. 2001. NOK
- Table 2 After-tax income for private households, by size of household, county, municipality and urban district. Median. 2001. NOK
- Table 3 After-tax income for persons living alone and couples without unmarried resident children in one-family households, by age, county, municipality and urban district. Median. 2001. NOK
- Table 4 After-tax income for couples with children (youngest child 0-17 years) in one-family households, by number of children in the household, county, municipality and urban district. Median. 2001. NOK
- Table 5 Privat households, by after-tax income, county, municipality and urban district. 2001. Numbers and per cent
- Table 6 Private households, by type of household, county, municipality and urban district. 3. November 2001
Contact
-
Statistics Norway's Information Centre
E-mail: informasjon@ssb.no
tel.: (+47) 21 09 46 42


