Content
Published:
This is an archived release.
First time mothers younger than the brides
First time mothers are younger than the first time brides of 2000; while the new mothers are 27.3 years old, the brides are two years their senior. Increasing numbers of cohabitants along with greater acceptance for lone mothers are relevant factors. The numbers can, at the same time, indicate that cohabitants marry when the children are born.
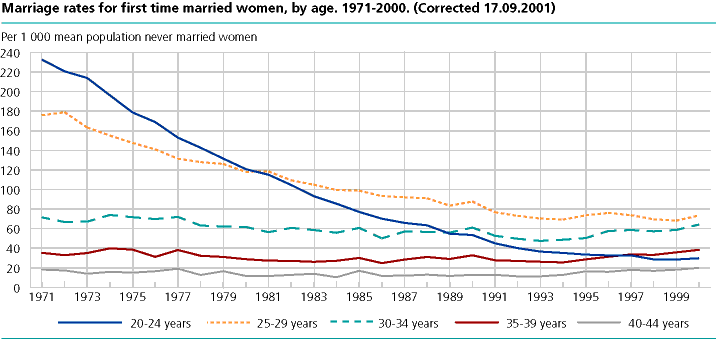
The average age for those who marry for the first time, is still increasing slowly but surly. While the women who got married for the first time in 2000 on average were 29.2 years old, the first time grooms were 31.8 years. For those who remarried in 2000 the average age was 42.2 years for women and 46.3 years for men.
25 400 marriages contracted - the highest since 1976
Not since the mid-1970's has the number of marriages contracted been as high as in 2000. 25 400 marriages were contracted last year, an increase of 1 900 since 1999. The level in 2000 resembles the level from the first half of the 1960's. A number for new cohabitant relationships in 2000 is not available.
Tables:
- Table 1 Marriages contracted, by residence status of bride and bridegroom. 1950-2000
- Table 2 Marriages contracted, by type of marriage. 1961-2000
- Table 3 Marriages, by previous marital status of the spouses. 1961-2000
- Table 4 Marriages, by county. 1966-2000
- Table 5 Average age at marriage. Males and females. 1961-2000
- Table 6 Marriage rates for first time married males and females in selected age groups. 1961-2000 (Corrected 19 September 2001)
- Table 7 Marriage rates for divorced males and females in different age groups. 1950-2000 (Corrected 19 September 2001)
- Table 8 Marriage rates for widowers and widows in different age groups. 1950-2000 (Corrected 19 September 2001)
- Table 9 Marriages, by age of bride and bridegroom. 2000
- Table 10 Marriages, by marriage number of bridegroom/bride. 1966-2000
- Table 11 Marriages contracted, by month. 1976-2000
- Table 12 Marriages contracted 2000. Citizenship of female and male
- Table 13 Marriages contracted, by citizenship of male and female. 2000
- Table 14 Partnerships contracted, by county. 1994-2000 (Corrected 7 January 2002)
- Table 15 Partnerships contracted, by age of the youngest and oldest partner. 2000
This page has been discontinued, see Marriages and divorces, Annually, detailed figures.
Contact
-
Anders Sønstebø
E-mail: anders.sonstebo@ssb.no
tel.: (+47) 46 66 37 74
-
Ane Margrete Tømmerås
E-mail: ane.tommeras@ssb.no
tel.: (+47) 91 99 29 62
-
Espen Andersen
E-mail: espen.andersen@ssb.no
tel.: (+47) 92 61 00 46
-
Statistics Norway's Information Centre
E-mail: informasjon@ssb.no
tel.: (+47) 21 09 46 42
-
Oppdrag befolkningsstatistikk
E-mail: befolkning@ssb.no