Content
Published:
This is an archived release.
More marriages between same sex couples
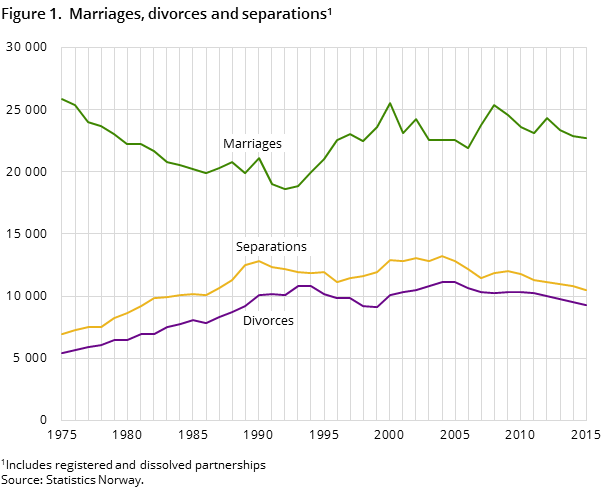
In 2015, 300 marriages were contracted between same sex couples. This is the most marriages of same-sex couples since the new marriages act was introduced in 2009. A total of 22 700 couples got married in 2015.
| 2014 | 2015 | Changes, absolute numbers | |
|---|---|---|---|
| 2014 - 2015 | |||
| Marriages contracted | 22 887 | 22 738 | -149 |
| Divorces | 9 556 | 9 306 | -250 |
| Separations | 10 824 | 10 507 | -317 |
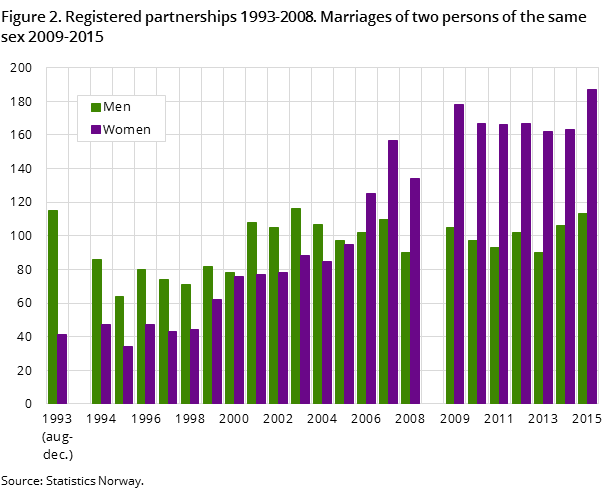
In the first year of the new marriages act, 283 same sex couples were married. In the five intervening years, an average of 263 marriages were contracted between persons of the same sex. Nearly two thirds of the same-sex couple marriages were between two women.
22 700 married in 2015
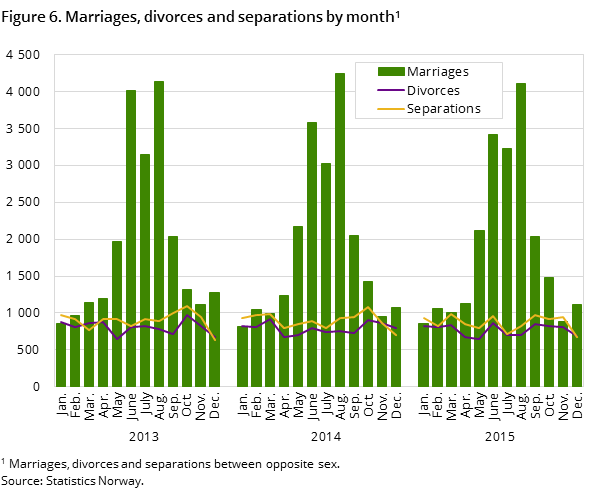
A total of 22 700 couples were married in 2015, which is slightly less than the previous year. Since 2008, when 25 300 couples got married, the number of marriages has gradually decreased, except in the year 2012. A total of 9 300 couples divorced and 10 500 couples separated in 2015. Of these, 68 and 90 were same sex couples respectively.
Further increase in average age at first marriage
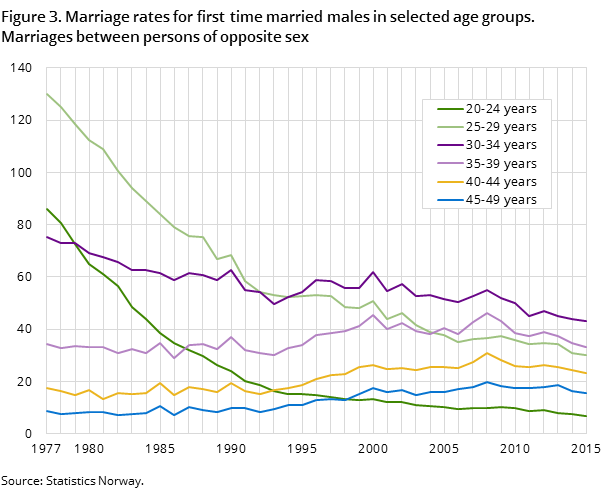
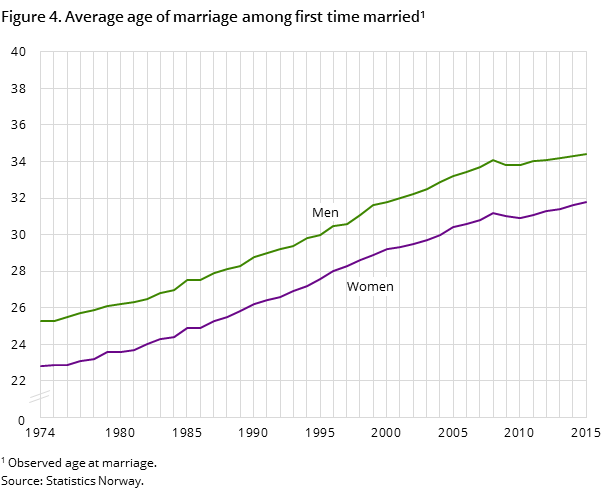
The marriage rate was still highest in the age group 30-34 years for both males and females, and the average age for first time married was 34.4 years for males and 31.8 years for females in 2015. This is an increase of 0.1 years for males and 0.2 years for females from 2014.
A comparison of the average age at first marriage with the other Nordic countries shows that Denmark is at the same level as Norway, while Sweden has a higher average age for both males and females; 35.8 years for males and 33.3 years for females. Finland has a lower average age than Norway, with 32.9 years for males and 30.6 years for females.
Fewer first marriages
Compared to 2014, the rate for first marriages decreased for both males and females in most age groups. The marriage rate for females aged 50 and older saw a slight increase.
Few of the young get married
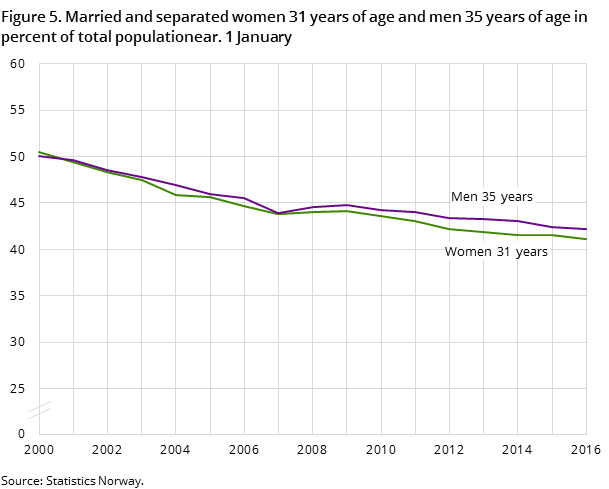
There are now far fewer married men and women in the younger age groups than previously. This is because more people are choosing cohabitation instead of marriage, and because more people are living together before they get married. At the turn of the century, for example, half of all 35 year-old men were married, while the corresponding figure for the last year was just 42 per cent. For women, 41 per cent of 31 year-olds were married last year compared with 50 per cent in the year 2000.
Low divorce rate
The divorce rate was 9.7 and 10.4 for men and women respectively in 2015, which is the lowest since the 1980s. The divorce rate was highest for men in the age group 45-49 years in 2015. For women, the divorce rate was highest in the age group 40-44 years.
In 2015, the parents of 8 700 children under 18 years of age divorced, and the parents of 11 100 children separated. There are no figures for separating cohabiting couples with children.
Low separation rate
The separation rate was 11.4 and 12.0 for men and women respectively in 2015. This is a decrease from 2014, and the lowest rate since 1999 when these calculations began.
It is most common to marry in the months from May to September, when two out of three weddings were held, with the most popular months being June and August.
Contact
-
Anders Sønstebø
E-mail: anders.sonstebo@ssb.no
tel.: (+47) 46 66 37 74
-
Ane Margrete Tømmerås
E-mail: ane.tommeras@ssb.no
tel.: (+47) 91 99 29 62
-
Espen Andersen
E-mail: espen.andersen@ssb.no
tel.: (+47) 92 61 00 46
-
Statistics Norway's Information Centre
E-mail: informasjon@ssb.no
tel.: (+47) 21 09 46 42
-
Oppdrag befolkningsstatistikk
E-mail: befolkning@ssb.no
