Content
Published:
This is an archived release.
About 15 per cent in employment are immigrants
Nearly 380 000 immigrants were employed in the 4th quarter of 2015. This group constituted 14.7 per cent of the total number of employed persons in Norway. This share was almost the same as in the preceding year. The largest group was immigrants from the EU countries in the east, constituting almost 114 000 persons.
| 2015 | ||
|---|---|---|
| Absolute figures | Per cent | |
| 1As from 2015, the statistics are based on new data sources. The total employment figure for the fourth quarter of 2015 is 60 000 lower than in the Labour Force Survey (LFS). The total figure in these two statistics was coordinated in previous years, thus showing the same number of employees. | ||
| Population in total | 2 587 704 | 66.1 |
| Non-immigrant population | 2 207 715 | 67.2 |
| Immigrants, total | 379 989 | 60.3 |
| The Nordic Countries | 47 167 | 73.3 |
| Western Europe except the Nordic Countries and Turkey | 42 463 | 67.2 |
| EU members in Eastern Europe | 113 613 | 68.8 |
| Eastern Europe outside of EU | 31 951 | 61.8 |
| North America and Oceania | 6 524 | 62.0 |
| Asia | 95 466 | 53.0 |
| Africa | 30 722 | 40.7 |
| South and Central America | 12 083 | 60.1 |


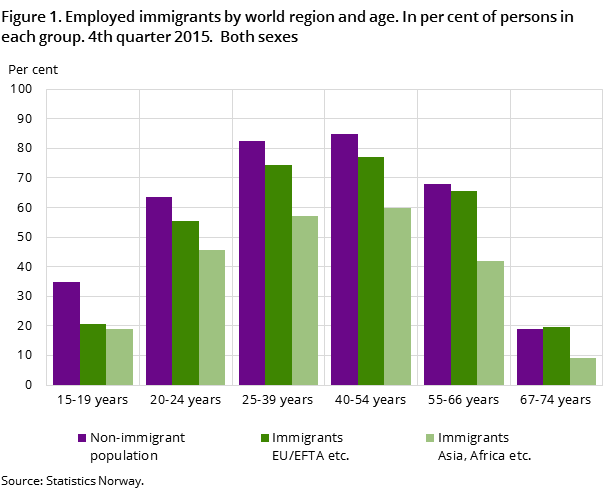
Immigrants had an employment rate of 60.3 per cent in the 4th quarter of 2015. In the rest of the population this rate was 67.2 per cent, i.e. a disparity of 6.9 percentage points. There are, however, large disparities among the immigrant groups. Immigrants from the EEA countries, who include large numbers of labour immigrants, have considerably higher rates than other immigrants. The employment rates among these groups in the 4th quarter of 2015 were as follows: 73.3 per cent (the Nordic countries), 68.8 per cent (EU countries in Eastern Europe) and 67.2 per cent (Western Europe). Next, we find immigrants from North America and Oceania and Eastern Europe outside the EU, with employment rates of about 62 per cent, while the group from Latin America lay slightly above 60 per cent. Asians, meanwhile, had a lower rate, at 53 per cent. As in earlier years, the African group had the lowest rate, at 40.7 per cent.
These disparities have been quite stable irrespective of economic cycles. Immigrants from Asia and Africa have larger shares of refugees with a shorter period of residence in Norway than other groups, and particularly the African immigrants. With a longer period residence, the employment level ascends within most of the immigrant groups, but the disparities among the groups do not level out. Even among those with 10 years or more of residence in Norway, African immigrants have the lowest employment rate, at 50 per cent, which is 10 percentage points below the average for immigrants.
Limitation of age groups impacts the employment disparity
As already noted, there is a disparity of 6.9 percentage points in the employment rate between immigrants and the Norwegian population as a whole within the age group 15-74 years, which is the population of the labour market statistics. For the population aged 15-66 years, however, this disparity is larger, at 11.5 percentage points. This is due to an enhanced level of employment among the majority population when the oldest stratum is excluded from the calculation. The majority population differ from the immigrant population, with a much larger share of people aged 67-74 years. Within the most occupationally active age group, 20-54 years, the disparity is even larger; with 15.4 percentage points. Within this age group, only Nordic immigrants have an employment rate that matches the majority’s level. Immigrants from the EU countries had, for instance, a disparity of 8.8 percentage points, while those from Asia and Africa were 22.3 and 35.6 percentage points below the level of the majority.
Larger gender disparities among immigrants
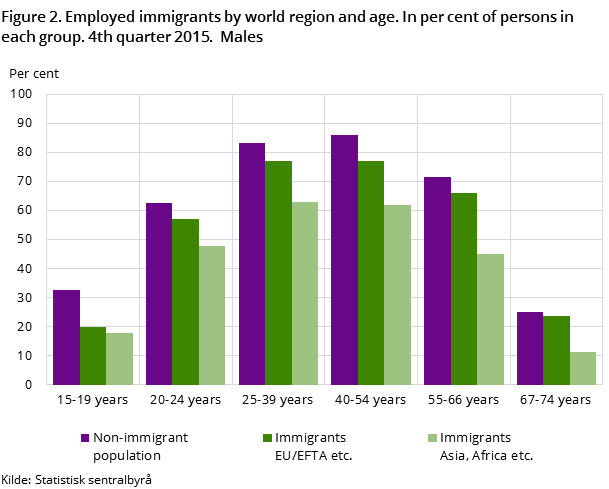
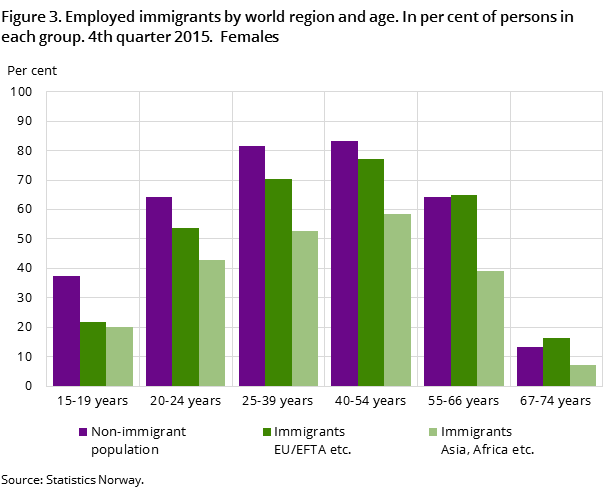
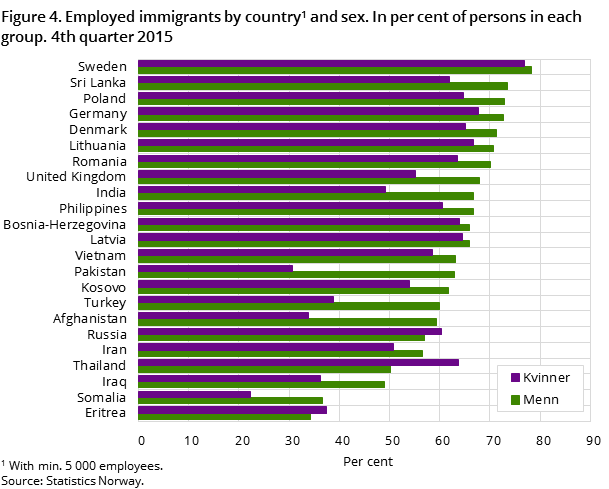
The employment rate was 63.7 per cent among immigrant men versus 56.4 among immigrant women, i.e. a difference of 7.3 percentage points. The corresponding disparity within the rest of the population was 3.8 percentage points; 69.1 per cent (men) versus 65.3 per cent (women). We find, however, groups with much larger gender disparities than the immigrant average, such as immigrants from Afghanistan, India, Iraq, Somalia and Turkey. On the other hand, immigrants from Bosnia, Chile, Myanmar, Serbia and Vietnam had gender disparities almost similar to the majority.
Norwegian-born to immigrant parents lie between the majority and immigrants
Norwegian-born to immigrant parents is still a rather small and young population group. Almost half of this group are below 22 years of age (within the 15-74 years population), and many will be in education and outside the labour force. Thus the employment rate will be considerably reduced when considering the group as a whole. However, if we look at the more occupationally active age groups, 25-29 years and 30-39 years, the employment rates are 71.7 and 74.6 per cent respectively. This is 11.4 and 6.4 percentage points above the immigrants’ level and 7 and 10.2 percentage points below the employment level in the population as a whole within the corresponding age groups.
Change in the time seriesOpen and readClose
The new data source gives us access to more precise figures on the number of employed persons. When using this new source, the number of employed persons is 60 000 lower than in the old data base, which used the number employed in the country according to the Labour Force Survey. This is a modest difference of 2.4 per cent compared to the total number employed, but as a result of the change in the data base the register numbers for the number employed in the 4th quarter of 2014 compared to the 4th quarter of 2015 do not express an actual change. For those who want to study changes in the labour market among immigrants, we recommend the unemployment statistics for the 4th quarter of 2015:
A new data sourceOpen and readClose
As from 2015, the register-based employment statistics will be based on a new data source for employees. Until the end of 2014, the main data source was The Central Register on Employers and Employees (EE register), produced by the Norwegian Labour and Welfare Organisation (NAV). In 2015, this reporting to NAV was coordinated with the reporting of earnings and personnel data to the Tax Administration and Statistics Norway. This common reporting system is called “a-ordningen” (the a-system). A-ordningen provides a better data basis compared to the EE register, as it is more accurate at the individual level and covers a greater number of employees.
Contact
-
Arbeidsmarked og lønn
E-mail: arbeidsmarked@ssb.no
-
Bjørn Olsen
E-mail: bjorn.olsen@ssb.no
tel.: (+47) 40 90 23 87
-
Christoffer Berge
E-mail: christoffer.berge@ssb.no
tel.: (+47) 91 33 46 96
