You can retrieve entire tables or parts of tables. The limits per extract are 800,000 data cells, and the number of queries is currently 30 per minute. The limit is per IP address, and can therefore apply to many colleagues at the same workplace.
On some days there will be a high load in the first few minutes after new figures are published at 08:00. Unless you need it, avoid the time period 07:55 – 08:15. Existing figures that are to be revised at 08:00 will be shown as 0 or dot in the time period 05:00 – 08.00. Metadata is updated at 05:00 and 11:30, and during these updates the tables are unavailable.
The API use the license Creative Commons Attribution 4.0 International (CC BY 4.0).
Also see specifications at GitHub PxApiSpecs and OpenAPI Specification.
Content
- Finding tables
- Basic information about the table
- Metadata for the table
- Retrieve data from table
- Queries against a table
- Output formats
- Elimination
- Valuesets
- Groupings (aggregation or selection)
- Footnotes
- POST queries
- Response codes
- Known issues
- Other
- Examples of code for using the API
- Contact
1. Finding tables
You can find tables
- Via the Statistics Norway interface PxWeb: https://www.ssb.no/en/statbank/ you can look up tables. Under the generated table lies "API query for this table." The URL for PxWebApi 2 can be copied or edited further as explained under Queries against a table.
- or via the API itself: https://data.ssb.no/api/pxwebapi/v2/tables?lang=en lists all tables. Parameter pagesize specifies how many tables are included per page. Parameter pagenumber specifies the page number in the hit list.
Search for tables with parameter query
The query parameter searches in table titles, variables, and variable values. The search is case-insensitive. The title filter restricts the search to the title field.
Examples:
- Search for "pizza" in all tables:
https://data.ssb.no/api/pxwebapi/v2/tables?lang=en&query=pizza
- Search for tables published on a given date or in a given time interval:https://data.ssb.no/api/pxwebapi/v2/tables/?lang=en&query=updated:20250908*
https://data.ssb.no/api/pxwebapi/v2/tables/?lang=en&query=updated:[20250908 TO 20250912*]
- Search for titles containing word "age" AND word starting with "child":
https://data.ssb.no/api/pxwebapi/v2/tables?lang=en&query=title:age AND child*
- Search for "commodity number" and "HS" less than 5 words apart:
https://data.ssb.no/api/pxwebapi/v2/tables?lang=en&query="commodity number hs" ~5
- Search for not discontinued tables where the title contains "children":
https://data.ssb.no/api/pxwebapi/v2/tables?lang=en&query=title:children&includeDiscontinued=false
- Search for not dicontinued tables where the title contains "enterprise" and where county (C) is the lowest regional division:
https://data.ssb.no/api/pxwebapi/v2/tables?lang=en&query=title:enterprises AND title:(C)&includeDiscontinued=false
Search for tables that have been recently updated
Use the parameter pastdays if you want to find tables that have been updated in, for example, the past 3 days: https://data.ssb.no/api/pxwebapi/v2/tables?pastdays=3&lang=en
2. Basic information about the table
Basic information about the table can be retrieved with a URL like this
https://data.ssb.no/api/pxwebapi/v2/tables/five digit table number?lang=en
Example from table 05810: https://data.ssb.no/api/pxwebapi/v2/tables/05810?lang=en
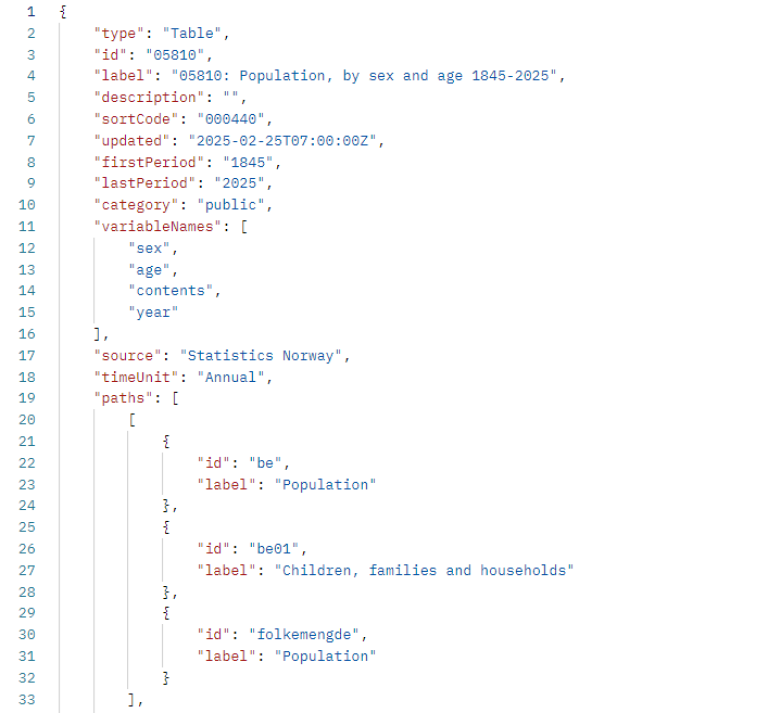
Here you can see among other things the table title (label), the first and latest period in the time series (firstPeriod and lastPeriod), and which variables are included (variableNames). Path shows the table's location(s) in the subject structure.
3. Metadata for the table
Detailed metadata for a given table number can be retrieved using a URL in the form https://data.ssb.no/api/pxwebapi/v2/tables/five-digit table number/metadata?lang=en. The metadata is displayed in the json-stat2 format, where objects are shown as { } and lists as [ ]. Extracts from here can be used to create the query.
Example from table 05810: https://data.ssb.no/api/pxwebapi/v2/tables/05810/metadata?lang=en
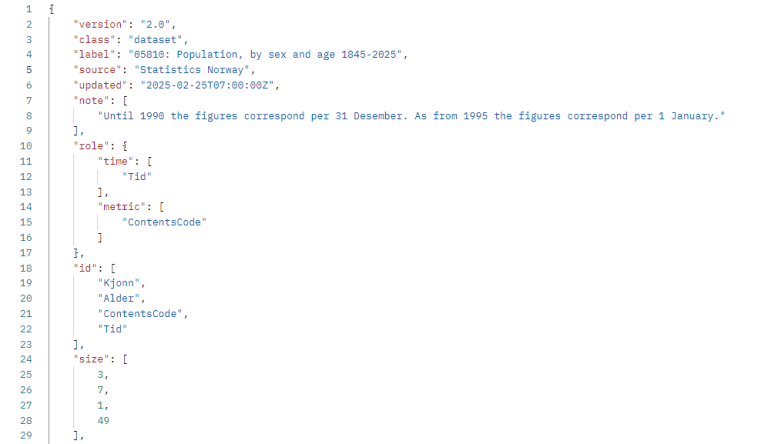
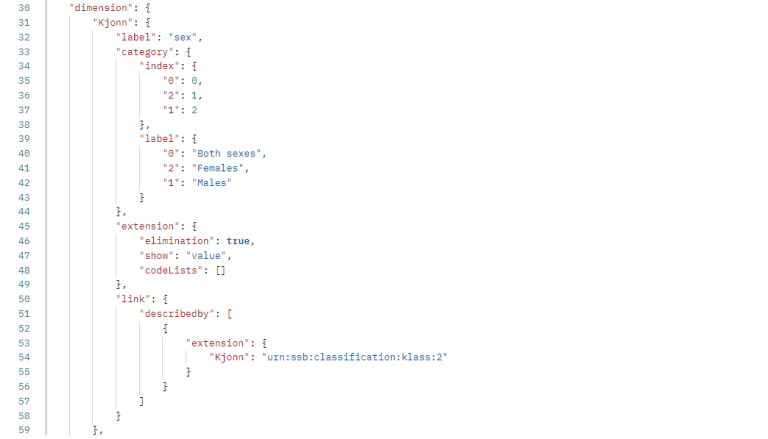
The metadata consists of a table title label (level 1) as well as a list of variables for the table. For the variable objects dimension (level 2), the most important properties are:
- Variable id (id)
- Variable name (label)
- Elimination (elimination)
Each variable object contains two lists (level 3), one with value codes index and one with presentation texts for the values label.
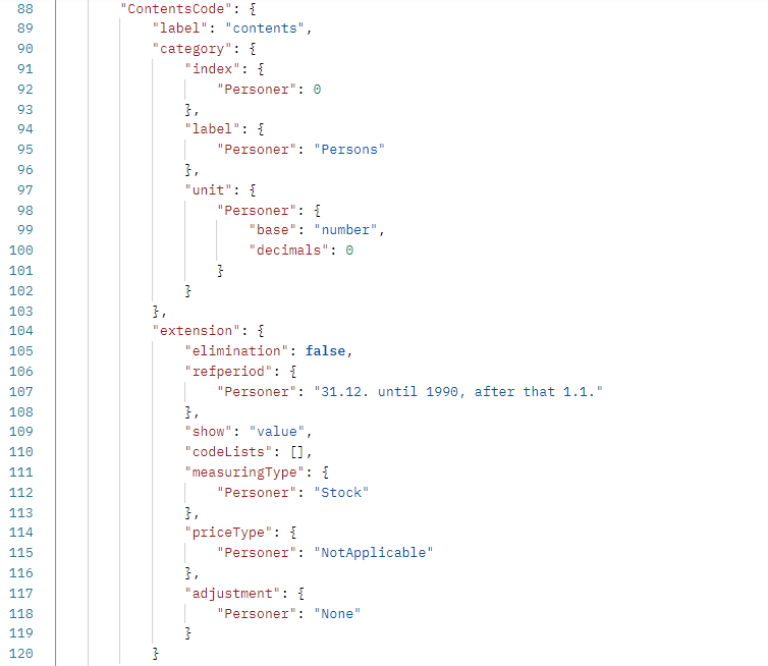
For contents variables, the unit of measurement and the number of decimals are always specified.
For each statistical variable, there may be under extension:
- Measuring type (measuringType: Stock, Flow, Average, Other)
- Price type (priceType: Current, Fixed, NotApplicable)
- Seasonal and calender adjustment (adjustment: SesOnly, WorkOnly, WorkAndSes, None)
- Base period (basePeriod)
4. Retrieve data from table
Data (figures) for a given table number can be retrieved with a URL in the following form https://data.ssb.no/api/pxwebapi/v2/tables/five-digit table number/data?lang=en .
For table 05810 https://data.ssb.no/api/pxwebapi/v2/tables/05810/data?lang=en will provide a table broken down by gender and age for the latest period. This corresponds to the default extraction you get when you select the same table in PxWeb. Please note that in the default table, only two dimensions will show more than one value. To extract numbers in multiple dimensions, this must be specified in the API query (see section Queries against a table).
The default format is json-stat2, but you can also choose other formats (see section Output formats).
5. Queries against a table
You can use PxWeb to build API queries, or you can use applications like Postman, Hoppscotch or similar to construct your own queries. In this guide, we will show examples of queries via Postman.
Parameters for use in queries
Use the lang parameter if you want the English language. The default language is Norwegian.
To specify variable and values, use valueCodes[variable-id]=value-index1, value-index2 etc.
You can specify one of several code lists for the variable, use codeList[variable-id]=code-list-id.
If the code list is a grouping, you can use outputValues[variable-id]=aggregated|single to specify whether you want aggregated or single values.
Use outputformat if you want to get something other than the default format.
Truncate with asterisk, mask individual characters with a question mark
In this example from table 03013, we retrieve numbers for the statistic variable (ContentsCode) KpiIndMnd for all consumption groups with a two-digit code (??) and for all months in 2020 (2020*):
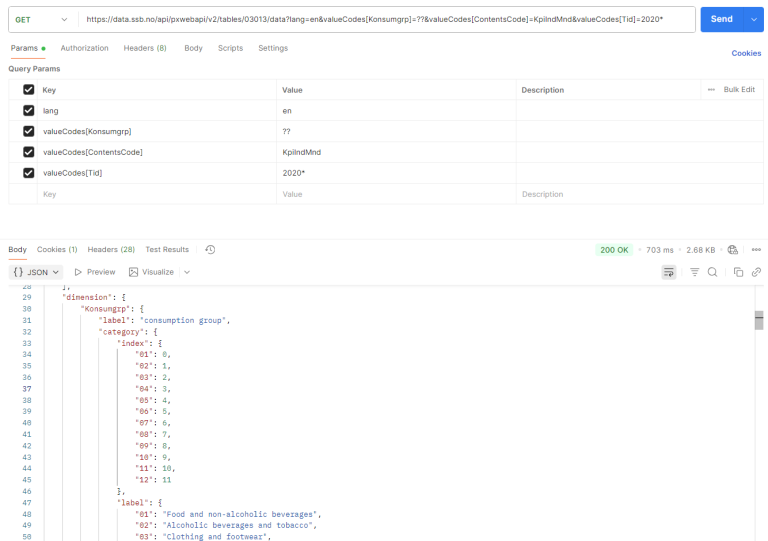
The generated URL looks like this: https://data.ssb.no/api/pxwebapi/v2/tables/03013/data?lang=en&valueCodes[Konsumgrp]=??&valueCodes[ContentsCode]=KpiIndMnd&valueCodes[Tid]=2020*
It is possible to set truncation signs both in front of and behind the search term.
Fetch the latest periods, or the first values
If you want figures for the n most recent months, you can use top(n):
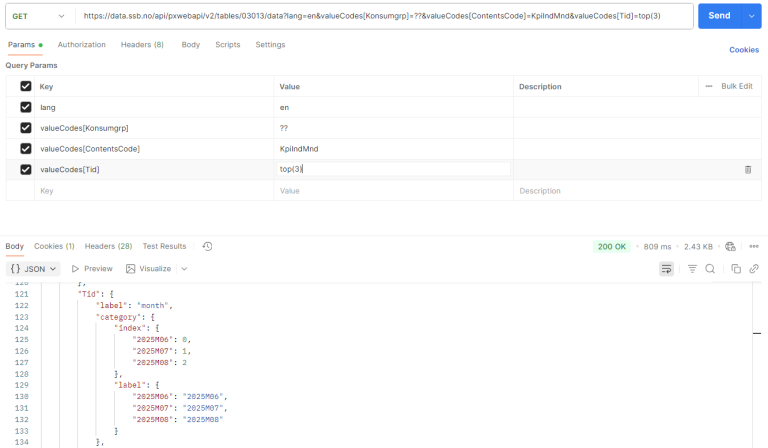
With [top(n, start)] you can retrieve n values starting from the start position. Bottom works the same way as top, but retrieves values from the end of the list.
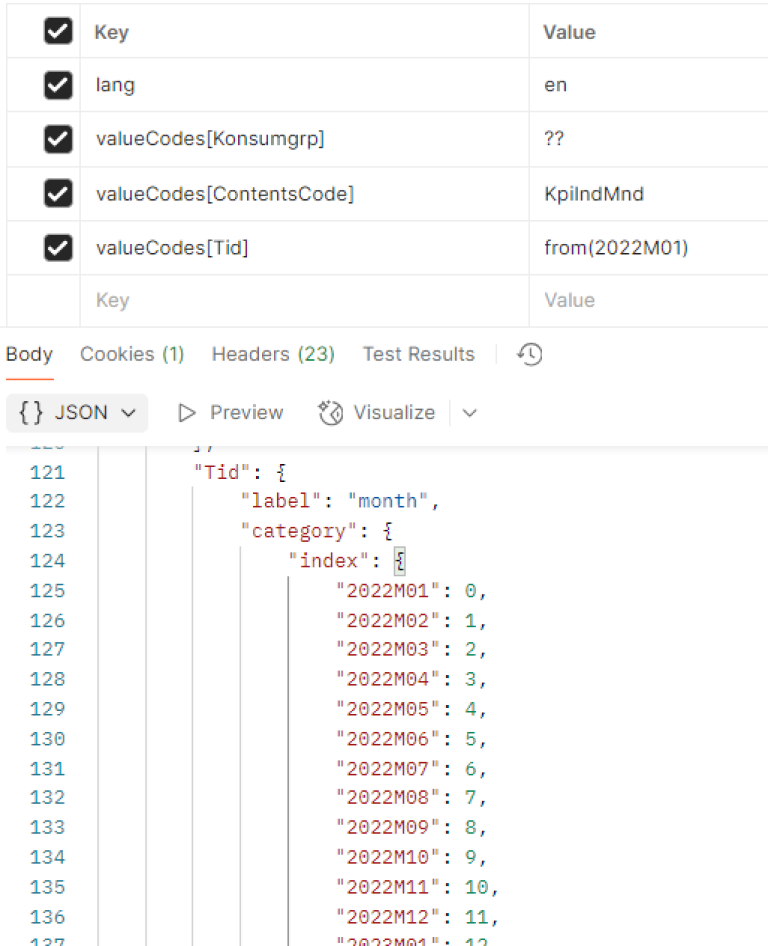
Fetch all values from a given starting value
If you want figures for all values from starting value x, you can use from(x):
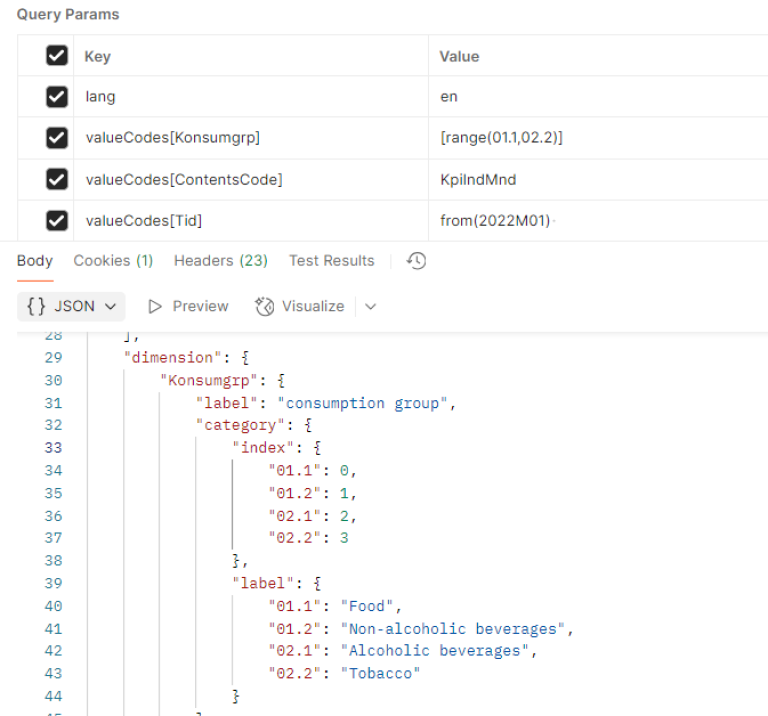
Retrieve all values in a given range
You can use [range (x,y)] to get all values in the range from x to y:
6. Output formats
The API can provide the result in 7 main formats:
- json-stat2 (JSON-stat, default)
- csv (text format)
- px (used in PxWeb and PxWin)
- xlsx (Excel)
- html
- json-px
For the formats csv, html and xlsx you can specify the display of code/text and table title:
- UseCodes (display codes)
- UseTexts (display text)
- UseCodesAndTexts (display codes and text)
- IncludeTitle (include table title)
And for csv files, you can choose between different separators:
- SeparatorTab (tabulator between columns)
- SparatorSpace (space between columns)
- SeparatorSemicolon (semicolon between columns)
Example:
In output formats csv, html, and xlsx, you can use stub to specify which variables to place in the front column of the table and heading for the variables to place in the table header.
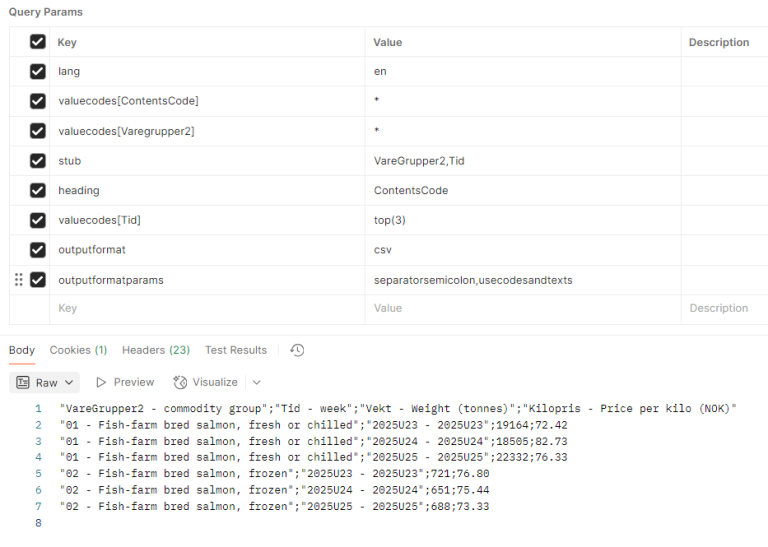
If you place all variables in the stub, you get a so-called pivot-friendly table: https://data.ssb.no/api/pxwebapi/v2/tables/03024/data?lang=en&valuecodes[ContentsCode]=*&valuecodes[Varegrupper2]=*&stub=VareGrupper2,Tid,ContentsCode&valuecodes[Tid]=top(3)&outputformat=csv&outputformatparams=separatorsemicolon,usecodesandtexts
The decimal separator is . (period) for all languages and all formats, except Excel in Norwegian where the decimal separator is comma.
7. Elimination
An eliminable variable can be completely removed from the query.
If the variable is eliminable (true), it will display:
- either an elimination value, usually the sum
- or all values will be aggregated into one.
If the variable is not eliminable (false), you must select something from it. Time and contents variable (ContentsCode) are not eliminable.
8. Valuesets
A variable can have multiple valuesets associated with it. In that case, these will be listed under endpoint metadata, specified as codeLists/vs. For example, the region variable can have both a county list and a municipality list:
https://data.ssb.no/api/pxwebapi/v2/codeLists/vs_Fylker?lang=en
https://data.ssb.no/api/pxwebapi/v2/codeLists/vs_Kommun?lang=en
You can specify which value range you want to retrieve numbers from by using parameter codelist when retrieving data: https://data.ssb.no/api/pxwebapi/v2/tables/01222/data?lang=en&valueCodes[Region]=*&valueCodes[ContentsCode]=Folketallet1&valueCodes[Tid]=from(2022K1)&codelist[Region]=vs_Fylker
9. Groupings (aggregation or selection)
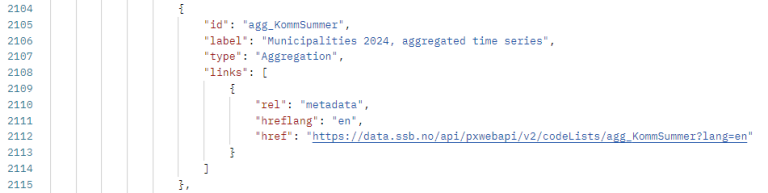
A variable can have groupings associated with it. In that case, groupings will appear under endpoint metadata, specified as codeLists/agg. An example from https://data.ssb.no/api/pxwebapi/v2/tables/07459/metadata?lang=en is Municipalities 2024, aggregated time series:
From https://data.ssb.no/api/pxwebapi/v2/codeLists/agg_KommSummer?lang=en you can see how the grouping is constructed:
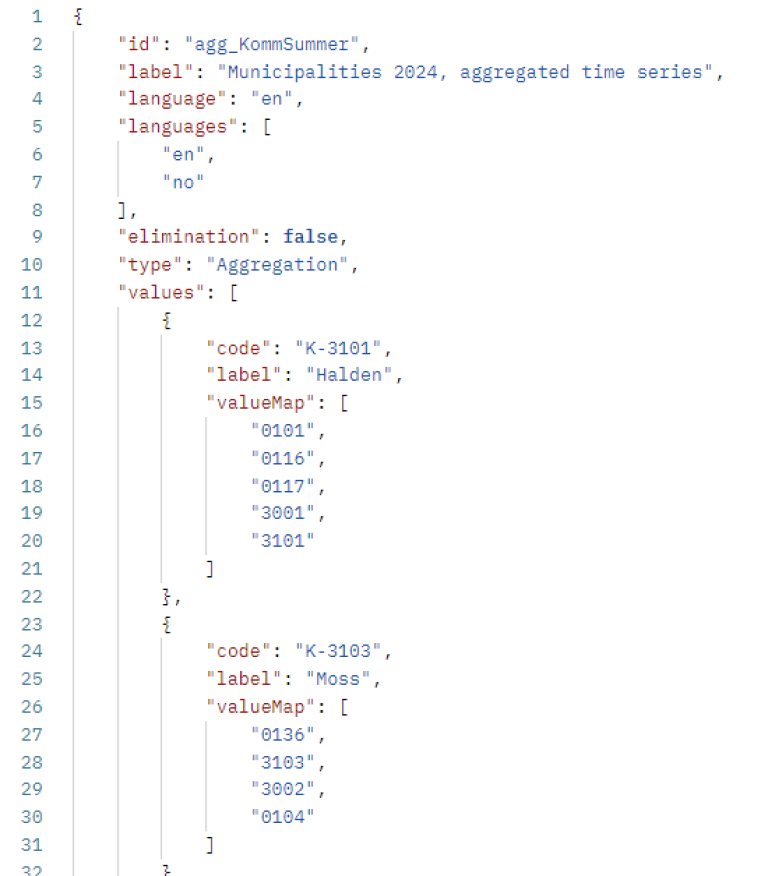
Under valueMap you can see which municipality codes are summed up to the group codes K-3101, K-3203, etc. The grouping is used together with outputValues[Region]= aggregated to select aggregated numbers, here to sum up numbers for merged municipalities and municipalities that have changed codes over the years. Example for Moss, which in 2020 was merged by municipalities 0104 and 0136, and which in 2024 changed code from 3002 to 3103:
https://data.ssb.no/api/pxwebapi/v2/tables/07459/data?lang=en&valueCodes[Region]=K-3103&valueCodes[Tid]=*&valueCodes[ContentsCode]=Personer1&codelist[Region]=agg_KommSummer&outputValues[Region]=aggregated
Another example from the same table is Counties 2024-:
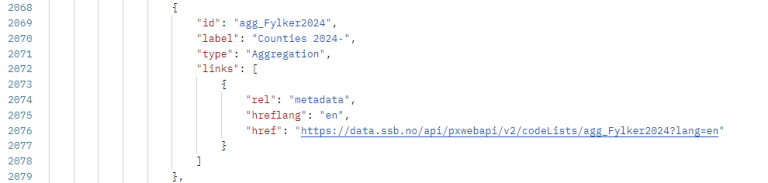
From https://data.ssb.no/api/pxwebapi/v2/codeLists/agg_Fylker2024?lang=en you can see how the grouping is constructed:
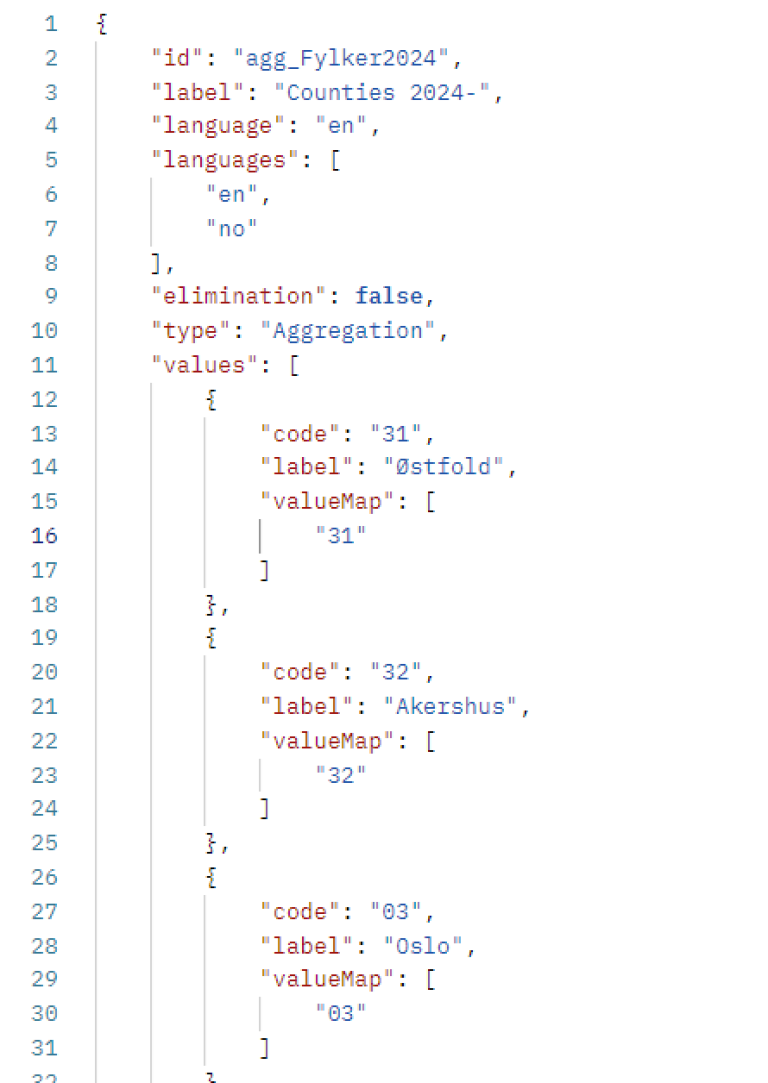
Here code and valueMap are the same. The grouping is used together with outputValues[Region]= single to select some values from the full list, in this case the latest county division.
Example where we retrieve figures for the latest year for all the current county codes: https://data.ssb.no/api/pxwebapi/v2/tables/07459/data?lang=en&valueCodes[Region]=*&valueCodes[ContentsCode]=Personer1&valueCodes[Tid]=top(1)&codelist[Region]=agg_Fylker2024&outputValues[Region]=single
10. Footnotes
Any footnotes are provided under note and may be associated with a table, variable, or value. Multiple footnotes may be attached to the same element. They are then separated by quotation marks and commas. See e.g.
https://data.ssb.no/api/pxwebapi/v2/tables/12880/metadata?lang=en.
11. POST queries
PxWebApi 2 also supports POST queries. See example at https://github.com/janbrus/ssb-api-python-examples/blob/master/PxWebApi2/laks_nor.ipynb
12. Response codes
Possible error codes if the query does not return a response:
400 – “Bad request” - errors in syntax of the query.
403 – Blocking when querying for large data sets. The API limit is 800,000 cells.
404 – Resource not found. May be due to a misspelled URL or URL exceeding the limit of approximately 2100 characters.
429 – Too many queries within a minute. The limit is 30 queries within 60 seconds. Run large queries in sequence. Get the result of the first, before you run the next.
503 – Service unavailable.
13. Known issues
Endpoint navigation has been removed for the time being. Instead, the endpoint tables shows the table's location(s) in the subject structure under paths.
Output format parquet has been removed for the time being.
The URL in the GET request cannot exceed a limit of approximately 2100 characters. Instead of listing long value lists in the query, use * (asterisk), question mark, from/to or range.
Also note that the GET URL that PxWeb generates will always list exactly the same periods that you selected. In practice, you will most often want the query to include all newer periods the next time you run it. In that case, you must adjust the URL to valueCode[Time]=* or =from(start time), alternatively =top(number of newest periods).
A tip to avoid editing long queries from PxWeb: Instead of selecting all values, choose the first one. Then it's easy to change this one value to * or from(value) in Postman or similar.
14. Other
How to use StatBank
Before using the API users should be used to the StatBank: How to use StatBank Norway.
It is useful to keep track of the page that provides structural changes and tables that are being terminated and replaced by new ones.
It happens that more values are added to existing code lists. Therefore, you will get a more robust query by using * (asterisk) after valueCode instead of listing all the values.
Special characters in URL
Some special characters are recoded in the URL:
(space) | %20 |
+ | %2B |
" | %22 |
( | %28 |
) | %29 |
[ | %5B |
] | %5D |
If you use Postman to create the query, the characters are changed automatically
Special characters in tables
The API can display special characters instead of figures:
. | Category not applicable |
.. | Data not available |
: | Confidential |
In json-stat2, the special characters are displayed under status, while the data is shown as null.
JSON
JSON syntax see: https://www.json.org.
We recommend having a JSON viewer in your browser. Many browsers have this built-in. You can also download add-ons such as https://jsonview.com.
JSON-stat
JSON-stat is a format specifically developed to display statistical tables, that is, datasets with many dimensions. JSON-stat represents the values in the data cubes as a flat array (row-major order). It shows a tree structure, with main elements dataset, dimension, and value with associated status. In addition, contents variables, geographical variables, and time are assigned their own roles ('role') for easy access.
JSON-stat is used by many statistical agencies, as well as the APIs of Eurostat and the World Bank. There are also ready-made libraries for, among others: Javascript, Python, R, and Java.
JSON-stat Toolkit is useful, especially for JavaScript. To understand the structure of JSON-stat, it is recommended to try out the JSON-stat explorer. The toolkit also includes JSON-stat Command Line Conversion Tools. These flexible conversion tools such as jsonstat2csv provide a better-customized CSV. This assumes that node.js is installed.
- jsonstat2csv - converts JSON-stat into CSV
- arrow2jsonstat - converts an Apache Arrow file to JSON-stat
- csv2jsonstat - converts CSV into JSON-stat
- jsonstat2array - converts JSON-stat into an array of arrays
- jsonstat2arrobj - converts JSON-stat into an array of objects
- jsonstat2arrow - converts JSON-stat to the Apache Arrow format
- jsonstat2objarr - converts JSON-stat into an object of column-oriented arrays
- jsonstat2object - converts JSON-stat into a Google DataTable object
- jsonstatdice - creates JSON-stat from JSON-stat
- sdmx2jsonstat - converts SDMX(JSON) into JSON-stat - convert OECD, UN and IMF API-data to JSON-stat
For JSON-stat examples in Javascript, see: https://observablehq.com/@jsonstat.
Links to classifications and variable definitions
In the JSON-stat datasets, we link to a classification like this: {"Kjonn": "urn:ssb:classification:klass:2"}. The number at the end is an ID so that urn:ssb:classification:klass:2 can be rewritten as: https://www.ssb.no/klass/klassifikasjoner/2 or this address in the Klass API: https://data.ssb.no/api/klass/v1/classifications/2?language=en.
Variable definitions are specified in JSON-stat in the form {CostType: "urn:ssb:conceptvariable:vardok:1116"} where 1116 is an ID. This can be rewritten to https://www.ssb.no/a/metadata/conceptvariable/vardok/1116/en. /en indicates language. The value can be either en, nb, or nn. If you add /xml after /a, you will get XML.
15. Examples of code for using the API
- See https://github.com/janbrus/ssb-api-v2-examples for code examples that use PxWebApi 2.
- PxWebApiData : Function to read PxWeb data into R via API.
16. Contact
Contact statistikkbanken@ssb.no if you have questions about the tables or the API. It is also possible to provide feedback on GitHub: