Content
Published:
This is an archived release.
Highest profitability in Rogaland
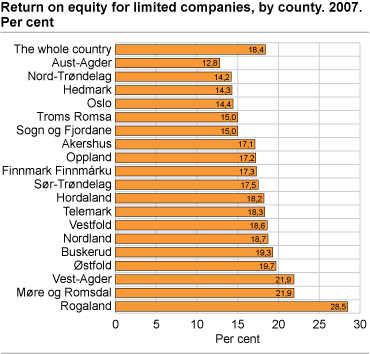
Profitability for Norwegian limited companies varies from county to county. Companies with head offices in Rogaland had a profit of NOK 29 per invested NOK 100, while their counterparts with headquarters in Aust-Agder obtained NOK 13 per invested NOK 100 in 2007.
In 2007, the average return on invested equity for non-financial companies was 18.4 per cent, which was a decline from 20.7 per cent in 2006. However, return on invested equity was significantly higher than in the first half of this decade.
The figures paint almost the same picture for mainland-Norway, where return on equity fell from 19.6 per cent in 2006 to 18.3 per cent in 2007, but was still above the level of the first years of this decade.
Significant regional differences in profitability...
Return on equity substantially varies with county. Non-financial companies in Rogaland achieved an average return on equity of 29 per cent in 2007. Vest-Agder and Møre og Romsdal had 22 per cent. The lowest return on equity was in Aust-Agder, where it was 13 per cent. Oslo, Hedmark and Nord-Trøndelag had each 14 per cent in return on equity. The high profitability in Rogaland was largely due to oil and gas extraction in the county, but profitability in the county was also above average in many other industries.
... and in equity ratio
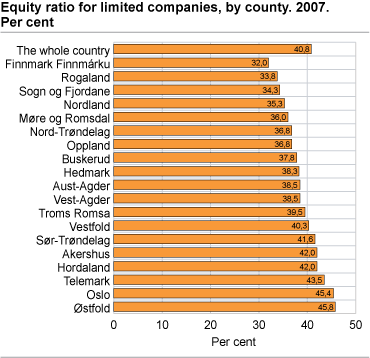
Equity comprised 40.8 per cent of total capital in 2007, a slight decrease from 41.0 per cent in 2006. Equity ratio was slightly higher in mainland-Norway. There it went up from 41.2 percent in 2006 to 41.8 per cent in 2007. There were also significant regional differences in equity ratio. With 45.8 per cent, Østfold had the highest equity ratio. Second was Oslo, with 45.4 per cent, and, with 43.5 per cent, Telemark was third. Finnmark, Rogaland, and Sogn og Fjiordane, with correspondingly 32.0, 33.8 and 34.3 per cent, experienced the lowest equity ratio in 2007.
About the statistical basisThe statistics for 2007 are based on information from a total of 186 366 non-financial limited companies. The information is obtained from the Register of Company Accounts in Brønnøysund.. Only non-financial companies that have submitted their accounts to the Register of Company Accounts are included in the statistics. The statistics do not cover financial sector companies engaged in financial activities and other financial services (commercial banks, savings banks, finance companies and other financial enterprises). Accounts containing serious errors or shortcomings in the income statement or balance sheet are excluded. Accounts for companies which are in the process of closing down are excluded, since these accounts have not been prepared using the going concern assumption. |
Regional distributionThe location of company headquarters was used to classify the company by county. However, some companies have activities in several counties. This should be taken into account when regional distribution in accounting statistics is being interpreted. The figures do not always reflect the location of the economic activity of the company. Tables with more detailed distribution by industry and county in StatBank.In StatBank, tables broken down by industry are now more detailed than they were previously. There are also more tables broken down by county. Tables for selected industries are published. Tables for hotels and restaurants (nace 55) are published together with this article. Similar tables for wholesale and retail trade (nace 50-52), construction (nace 45), road goods transport (nace 6024) and the information sector will be published in the near future. Tables for the information sector and road goods transport will replace the special accounts statistics previously published for these industries. Tables for more industries will gradually be published in the same way. |
Tables:
The statistics is published with Accounting statistics for non-financial limited companies.
Contact
-
Statistics Norway's Information Centre
E-mail: informasjon@ssb.no
tel.: (+47) 21 09 46 42


