Content
Published:
This is an archived release.
Growth within management consultancy
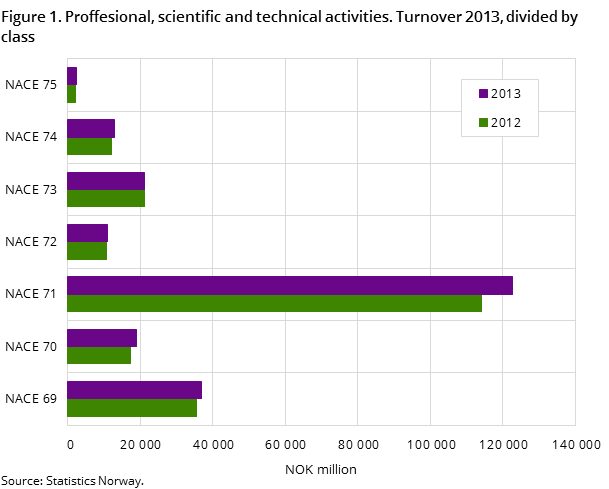
The local kind-of-activity units within management consultancy activities experienced an increase in turnover in 2013 of 8.8 per cent compared to 2012, to a total of NOK 18.9 billion. Employment rose by 3.4 per cent, to 12 696 persons. The compensation of employees amounted to a total of NOK 7.7 billion; an increase of 8.5 per cent.
| Number/NOK million | In per cent | ||
|---|---|---|---|
| 2013 | 2012 - 2013 | 2009 - 2013 | |
| Enterprises | |||
| Number of enterprises | 107 671 | 1.8 | 9.0 |
| Employment | 286 247 | 2.2 | 12.9 |
| Turnover | 531 078.9 | 4.2 | 26.5 |
| Value added | 267 919.4 | 5.1 | 30.0 |
| Gross operating surplus | 119 534.5 | 4.3 | 31.3 |
| Local kind-of-activity units | |||
| Lokal KAUs | 110 926 | 1.9 | 9.1 |
| Employment | 283 763 | 1.9 | 12.5 |
| Turnover | 528 280.3 | 4.0 | 26.2 |
| Compesation of employees | 147 204.7 | 5.3 | 28.4 |
| Gross investments | 44 167.1 | -6.9 | 13.0 |

The turnover has risen every year from 2009 to 2013, by a total of 35 per cent. Employment increased by 17 per cent in the same period.
7.5 per cent increase within architectural and technical consultancy
The units within architectural and technical consultancy activities had a total turnover of NOK 123 billion in 2013; an increase of 7.5 per cent compared to 2012. This division has also experienced growth in turnover every year since 2009. Turnover in this period has risen by 25 per cent. Employment rose by 3 per cent, to a total of 52 217 persons. The compensation of employees was NOK 41.8 billion; an increase of 8.9 per cent per cent compared to 2012.
In total, the local-kind-of-activity units within professional, scientific and technical activities saw an increase in turnover of 6.1 per cent, to a total of NOK 226 billion in 2013.
3.6 per cent increase within rental and leasing activties
The units within rental and leasing activties had a total turnover of NOK 39.4 billion in 2013; an increase of 3.6 per cent compared to 2012. In comparison, the growth in 2011 and 2012 was 7.8 per cent and 5.8 per cent respectively.
Lower growth within employment activities
The units operating within employment activties had a growth in turnover of 5.9 per cent, rising to a total of NOK 35.4 billion in 2013. This growth is nevertheless lower compared to 2011 and 2012, which was 30.9 per cent and 14.6 per cent respectively. The number of persons employed in this class was 53 180 in 2013.
In total, the local-kind-of activity units within office administrative, office support and other business support activities had a turnover of almost NOK 170 billion; an increase of 3.2 per cent compared to 2012.
Low growth within real estate activities
The turnover within real estate activities increased by 1.6 per cent, to a total of NOK 132.1 billion. In comaprison, the growth in 2012 was 8.7 per cent. The 47 018 local-kind-of activtiy-units employed 27 436 persons, approximately unchanged compared to 2012. The compensation of employees amounted to a total of NOK 13.1 billion; an increase of 4.1 per cent. Gross investments amounted to a total of NOK 34 billion, a decrease of 7.8 per cent compared to 2012.
Joint tables available in AprilOpen and readClose
Joint tables including all industry sections, divisions and groups will be available in Statbank at 10.00 am on 30 April.
The statistics is now published as Business statistics.
Contact
-
Statistics Norway's Information Centre
E-mail: informasjon@ssb.no
tel.: (+47) 21 09 46 42
