Content
Published:
This is an archived release.
Reduced surplus
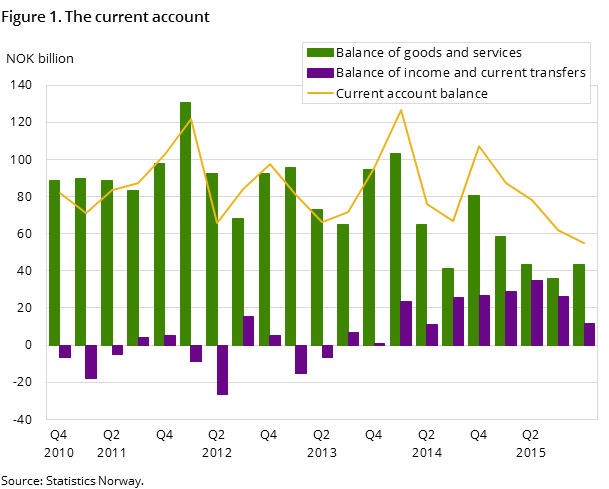
Surplus on Norway’s current account with the rest of the world is estimated at NOK 55 billion in the 4th quarter of 2015. In total for 2015, the current account surplus was NOK 283 billion, which is NOK 94 billion lower than 2014.
| 4th quarter 2014 | 1st quarter 2015 | 2nd quarter 2015 | 3rd quarter 2015 | 4th quarter 2015 | |
|---|---|---|---|---|---|
| Current account balance | 107 173 | 87 472 | 78 023 | 62 079 | 54 977 |
| Balance of goods and services | 80 359 | 58 403 | 43 494 | 35 662 | 43 232 |
| Balance of income and current transfers | 26 814 | 29 069 | 34 529 | 26 417 | 11 745 |
| Capital transfers to abroad, net | 187 | 719 | 122 | 24 | 5 |
| Net lending, current account | 106 986 | 86 741 | 77 901 | 62 055 | 54 972 |
| Direct investment | 83 068 | 40 187 | 43 971 | 37 982 | 68 694 |
| Portofolio investment | -21 819 | 4 715 | 145 526 | 116 634 | 40 061 |
| Other investments | 72 521 | -5 410 | -139 297 | -33 211 | -12 988 |
| Reserve assets (IMF breakdown) | -15 185 | 17 995 | -5 526 | -24 023 | -34 050 |
| Net lending, financial account | 118 585 | 57 487 | 44 674 | 97 382 | 61 717 |
| Net errors and omissions | -11 599 | 29 254 | 33 227 | -35 327 | -6 745 |

Low prices on oil and gas
The balance of goods and services in the 4th quarter of 2015 was higher than the 3rd quarter, but in line with the 2nd quarter. In total for 2015, the balance of goods and services was estimated at NOK 181 billion, which is NOK 109 billion lower than 2014.
The main explanation for the low balance of goods and services is the low prices on oil and gas in this period. The low export values on oil and gas almost entirely explain the annual decrease in the balance of goods and services.
For more information about exports and imports, including price and volume considerations and seasonal adjustments, please see the quarterly national accounts.
Balance of income and current transfers still positive
The balance of income and current transfers ended at NOK 12 billion in the 4th quarter of 2015. Normally the balance of income and current transfers varies significantly from quarter to quarter. In total, the balance of income and current transfers was NOK 102 billion for 2015, which is NOK 15 billion higher than 2014.
Strong reduction of deposits to and from Norway
In the 4th quarter of 2015, total net sales of financial assets amounted to NOK 286 billion. A reduction in other financial investments almost completely dominated this development, with a decline of NOK 277 billion. Here deposit-taking corporations except the Central Bank reduced their deposits abroad by NOK 258 billion, mainly within intercompany relationships. On the liability side, total net sales were NOK 348 billion. Other financial investments were considerably reduced with NOK 264 billion. Also here there was a drop in deposits, partly driven by foreign central banks, with a reduction amounting to NOK 129 billion.
RevisionsOpen and readClose
Balance of goods and services are revised for the first three quarters in 2015 as a result of new information.
Balance of income and transfers has been revised significantly for all quarters in 2014 as well as the first three quarters of 2015. This is because of new information about reinvested earnings.
For the Financial Account Revisions have been made back to the 1st quarter of 2014, with updated figures for reinvested earnings included.
Additional information
For more information about price and volume growth of exports and imports, see the quarterly national accounts.
More details about exports and imports of goods and services are available in the statistics on external trade in goods and services.
Contact
-
Håvard Sjølie
E-mail: havard.sjolie@ssb.no
tel.: (+47) 40 90 26 05
-
Linda Wietfeldt
E-mail: linda.wietfeldt@ssb.no
tel.: (+47) 40 90 25 48
