Content
Published:
This is an archived release.
NOK 91 billion surplus
The surplus on the current account was NOK 91 billion in the 4th quarter of 2010. The result was NOK 22 billion higher than in the 3rd quarter.
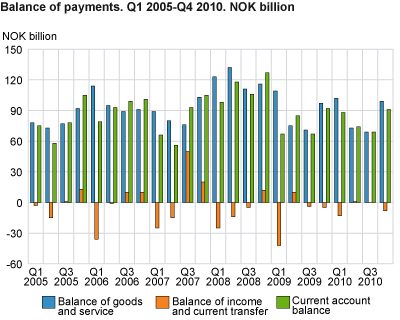
Increased surplus on the goods and services balance contributed positively to the current account, while the deficit on the income and current transfers balance pulled the current account balance in the opposite direction. Overall for 2010, the current account was estimated at NOK 322 billion, compared to NOK 312 billion last year.
Increased surplus on the goods and services balance
The surplus on the goods and services balance amounted to NOK 99 billion in the fourth quarter of 2010. Compared to the third quarter this constituted an improvement of NOK 30 billion. The export of both goods and services was higher in the fourth quarter compared to the third. Reduced import of services also contributed to the improved current account balance, while higher import of goods worked in the other direction. The export of goods increased mainly due to higher prices on oil and gas in the fourth quarter, in addition to low production due to maintenance work on the offshore oil installations in the third quarter. Compared to the third quarter, export of oil and gas increased by NOK 24 billion.
The surplus on the goods and services balance is estimated at NOK 342 billion for 2010, NOK 10 billion lower than in 2009.
Increased current transfers from general government
For the income and current transfers balance a deficit on NOK 8 billion was estimated in the fourth quarter, compared to a weak deficit in the third quarter. The increased deficit is related to several conditions, mostly though to increased current transfers from general government. For 2010 altogether the net compensation of employees and investment income increased by NOK 23 billion. This was the most important reason for the improved current account balance in 2010.
Large portfolio investment both abroad and in Norway
In the 4th quarter of 2010 the Norwegian portfolio investment abroad amounted to NOK 83 billion. In 2010 the total outward portfolio investment amounted to NOK 313 billion compared with only NOK 37 billion in 2009. The Government Pension Fund Global is the key investor and shifted its investment from shares to bonds through 2010 after large share investment in 2009.
Foreign portfolio investment in Norway increased from NOK 24 billion in 2009 to NOK 196 billion in 2010. Bonds issued by mortgage companies dominated the foreign portfolio investment in 2010.
Revisions
As a result of new information, the balance of payments has been revised for the first three quarters of 2010. The current account balance has been revised down with respectively NOK 2, 1 and 4 billion in the three quarters. The financial account has also been revised for 2009.
|
For more information about price and volume growth of exports and imports, see the quarterly national accounts . More details about exports and imports of goods are available in the statistics on external trade in goods . For more information on the external account, see the theme page . |
| 2009 | 2010 | 1. quarter 2008 | 2. quarter 2008 | 3. quarter 2008 | 4. quarter 2008 | 1. quarter 2009 | 2. quarter 2009 | 3. quarter 2009 | 4. quarter 2009 | 1. quarter 2010 | 2. quarter 2010 | 3. quarter 2010 | 4. quarter 2010 | ||||||||||||||||||||||||||||||||||||||||||||||||||||||||||||||||||
|---|---|---|---|---|---|---|---|---|---|---|---|---|---|---|---|---|---|---|---|---|---|---|---|---|---|---|---|---|---|---|---|---|---|---|---|---|---|---|---|---|---|---|---|---|---|---|---|---|---|---|---|---|---|---|---|---|---|---|---|---|---|---|---|---|---|---|---|---|---|---|---|---|---|---|---|---|---|---|---|
| Balance of goods and services | 352 | 343 | 123 | 132 | 111 | 116 | 109 | 75 | 71 | 97 | 102 | 73 | 69 | 99 | |||||||||||||||||||||||||||||||||||||||||||||||||||||||||||||||||
| Balance of income and current transfers | -41 | -20 | -25 | -14 | -5 | 12 | -42 | 10 | -4 | -5 | -13 | 1 | 0 | -8 | |||||||||||||||||||||||||||||||||||||||||||||||||||||||||||||||||
| Current account balance | 312 | 322 | 98 | 118 | 106 | 127 | 67 | 85 | 67 | 92 | 88 | 74 | 69 | 91 | |||||||||||||||||||||||||||||||||||||||||||||||||||||||||||||||||
| Capital transfers etc. to abroad, net | 1 | 1 | 0 | 0 | 1 | 0 | 0 | 1 | 0 | 0 | 1 | 0 | 0 | 0 | |||||||||||||||||||||||||||||||||||||||||||||||||||||||||||||||||
| Net lending | 311 | 322 | 98 | 118 | 105 | 127 | 67 | 85 | 67 | 92 | 88 | 74 | 69 | 91 | |||||||||||||||||||||||||||||||||||||||||||||||||||||||||||||||||
| Direct investment, net | 132 | -8 | 20 | 28 | 35 | 3 | 26 | 12 | 67 | 27 | 50 | 30 | -47 | -40 | |||||||||||||||||||||||||||||||||||||||||||||||||||||||||||||||||
| Portifolio investment, net | 12 | 117 | 135 | 77 | 209 | 224 | 82 | 48 | 15 | -133 | 21 | -48 | 88 | 56 | |||||||||||||||||||||||||||||||||||||||||||||||||||||||||||||||||
| Other investment, net | 373 | 134 | -68 | 24 | -124 | -155 | 14 | 103 | 27 | 228 | 4 | 153 | -28 | 5 | |||||||||||||||||||||||||||||||||||||||||||||||||||||||||||||||||
| Revaluations, net | 26 | 183 | -87 | -115 | 81 | -44 | -239 | 220 | 138 | -92 | 85 | -27 | 46 | 79 | |||||||||||||||||||||||||||||||||||||||||||||||||||||||||||||||||
| Increase in Norway`s net assets | 337 | 504 | 11 | 3 | 186 | 84 | -172 | 305 | 205 | 0 | 173 | 47 | 115 | 169 | |||||||||||||||||||||||||||||||||||||||||||||||||||||||||||||||||
Additional information
For more information about price and volume growth of exports and imports, see the quarterly national accounts.
More details about exports and imports of goods and services are available in the statistics on external trade in goods and services.
Contact
-
Håvard Sjølie
E-mail: havard.sjolie@ssb.no
tel.: (+47) 40 90 26 05
-
Linda Wietfeldt
E-mail: linda.wietfeldt@ssb.no
tel.: (+47) 40 90 25 48